Jobs may be booming — but wages and income are only increasing for those at the top.
Wages
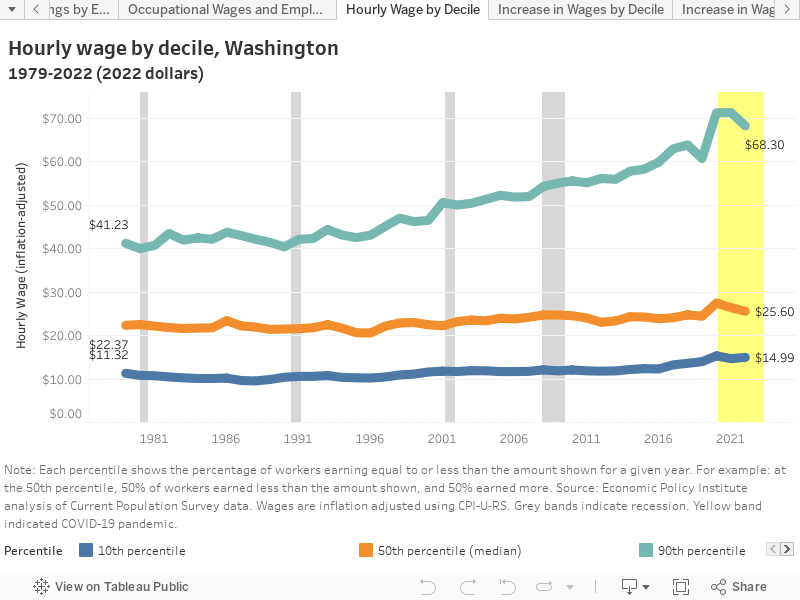
Since 2008, wages have stalled for two-thirds of Washington’s jobs, while already high-wage jobs have seen big gains. However, that trend goes back much further than the Great Recession. In fact, looking all the way back to 1979, wages for the bottom 60 percent of Washington workers have increased just $0.54/hour after adjusting for inflation; meanwhile, the top 10 percent have seen hourly wages jump more than $17 per hour.[3]

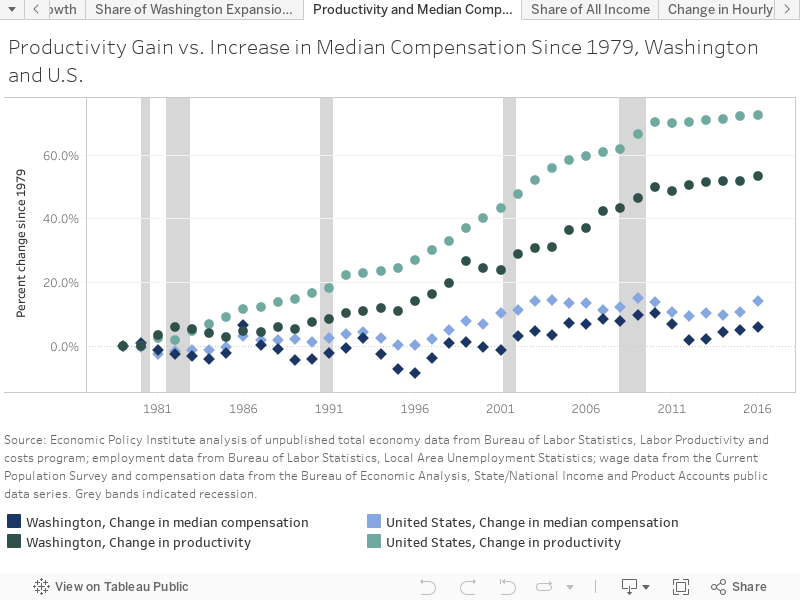
Over that same period, Washington’s economic productivity increased more than 53 percent – but median compensation (where 50 percent of wage earners earn less, and 50 percent earn more) grew just 6 percent, as the benefits of growth flowed increasingly to the top in the form of higher wages and corporate profits.[4],[5]

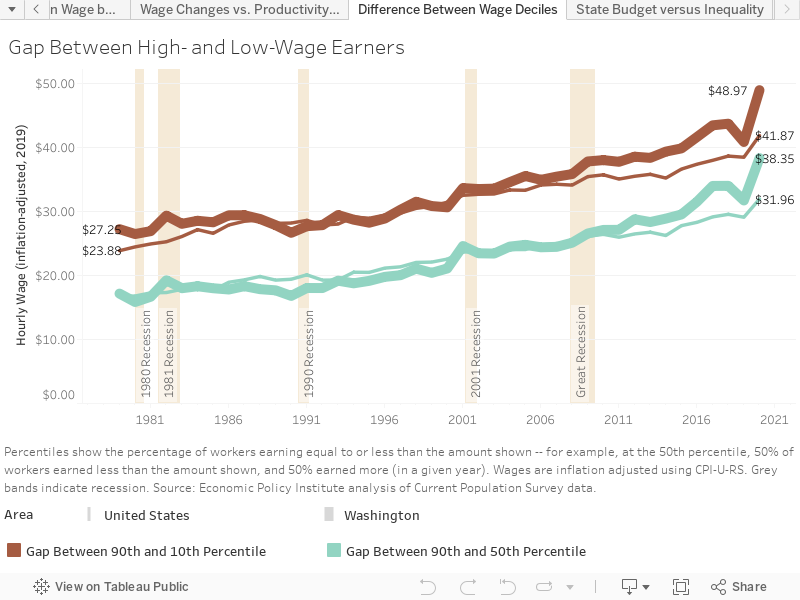
Throughout the 1980’s, the relative difference in hourly wages between high- and low-wage workers was relatively stable in Washington – ranging from $25 to $27/hour (top 10 percent vs. lowest 10 percent), and $16 to $18/hour (top 10 percent vs. bottom 50 percent).
That’s not to say all was well during this time. While wages fluctuated – and on net, declined to some degree for workers at all levels – as a percentage of their hourly wage, the lowest-paid 20 percent of workers (who were earning less to begin with) saw bigger drops and smaller increases in pay than did those in higher wage brackets. Washington’s landmark voter-approved 1998 minimum wage law helped limit losses for low-wage workers, and in 2017 (after another voter-approved minimum wage increase), the lowest-paid 20 percent of workers have finally begun to make some headway.[6]
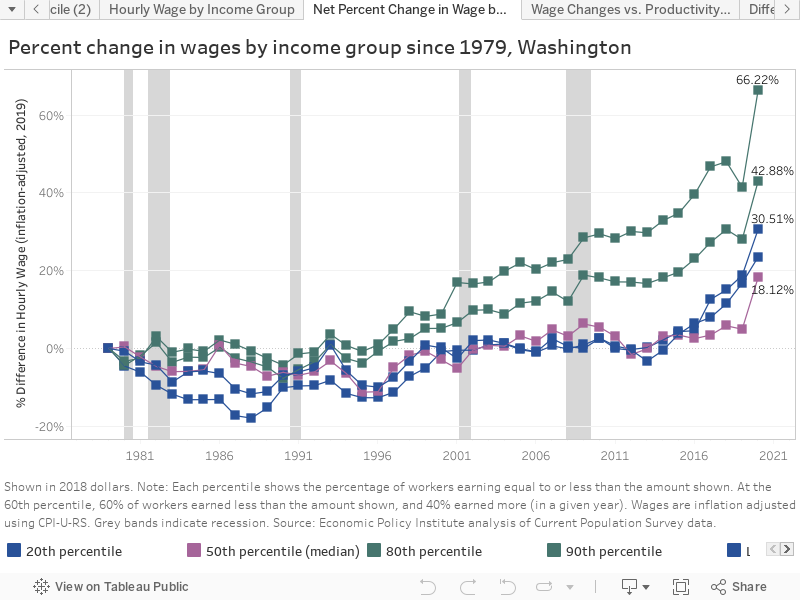

During the 1990s, the wage gap between the top 10 percent and bottom 10 percent in Washington began to grow, eventually matching U.S. levels; by 2001, the gap between the top 10 percent and bottom 50 percent had done the same. That trend intensified in the years leading up to the Great Recession, as the state’s top 10 percent/bottom 10 percent gap began growing faster than that of the U.S. In the years since the Great Recession, the top 10 percent/bottom 50 percent gap has also grown much faster in Washington than nationwide.
As of 2017, the difference in hourly wages between high- and low-wage workers in Washington has reached $33/hour (top 10 percent vs. bottom 50 percent) and $42/hour (top 10 percent vs. lowest 10 percent) – far outpacing the U.S. as a whole.

Income
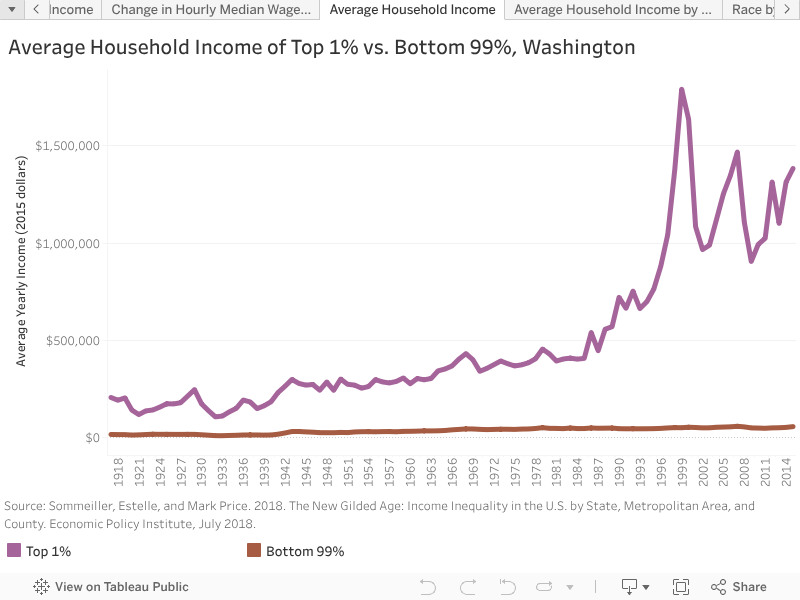
Hourly earnings are the most important source of total income for many households. But Social Security, pensions, investment income, and other sources also contribute. Investment income in particular contributes substantially to inequality growth. As of 2015, it takes a yearly income of $451,395 to be in the top 1% in Washington. The average income of the state’s top 1 percent ($1,383,223) was 24 times that of the bottom 99 percent ($57,100).
It hasn’t always been this way. Even during the so-called Roaring Twenties (late 1920’s) – during which the share of America’s wealth controlled by the richest of the rich increased rapidly – the top 1 percent brought in just 12 times the income of the bottom 99 percent. Post-WWII (from 1945 to 1973), Washington’s top 1 percent captured only 8.4 percent of overall income growth, such that as of 1973, incomes for the richest 1 percent of households were 9 times that of the other 99 percent. Since then, however, the top 1 percent has captured 43 percent of income growth, leaving far less for people further down the income ladder.[7]

Footnotes
[3] “Wages” include only hourly or salaried remuneration to employees.
[4] “Compensation” includes wage and salary disbursements, as well as supplements such as employer contributions for employee retirement plans, health coverage and social insurance. Note that to the extent that increased costs for health coverage represents only inflation, it is not an added benefit for employees, though it is included in measures of compensation.
[5] Sources: Bureau of Economic Analysis, Real GDP by state, All industry total. Economic Policy Institute analysis of unpublished total economy data from Bureau of Labor Statistics, Labor Productivity and costs program; employment data from Bureau of Labor Statistics, Local Area Unemployment Statistics; wage data from the Current Population Survey and compensation data from the Bureau of Economic Analysis, State/National Income and Product Accounts public data series.
[6] Initiative 688 (approved by Washington voters in 1998) increased the minimum wage and required Washington state to make a yearly cost-of-living adjustment to the minimum wage starting in 2001. Initiative 1433 (approved by Washington voters in 2016) requires a statewide minimum wage of $11.00 in 2017, $11.50 in 2018, $12.00 in 2019, and $13.50 in 2020. Beginning in 2021, the minimum wage will receive a yearly cost-of-living adjustment.
[7] Sommeiller, Estelle, and Mark Price. 2018. The New Gilded Age: Income Inequality in the U.S. by State, Metropolitan Area, and County. Economic Policy Institute, July 2018.
More To Read
A Fair Deal at Work
July 19, 2024
What do Washingtonians really think about taxes?
Most people understand that the rich need to pay their share
A Fair Deal at Work
June 5, 2024
How Washington’s Paid Leave Benefits Queer and BIPOC Families
Under PFML, Chosen Family is Family
A Fair Deal at Work
May 24, 2024
Why Seattle’s City Council is Considering Delivering Poverty Wages to Gig Workers
Due to corporate pressure, Seattle’s new PayUp ordinance might be rolled back just 6 months after taking effect