For a PDF, click here.
Executive Summary
Washington’s booming industries have led to a job market that requires a highly educated and trained workforce. However, Washingtonian high-school graduates from a variety of backgrounds have faced barriers in accessing higher education, and thus have experienced little of the benefits of our economic growth.
This brief demonstrates how geographical, racial/ethnic and income/wealth gaps reinforce each other in a variety of ways, demonstrated by an analysis of four counties – Grant, Chelan, Grays Harbor, and Pierce. In each, the gaps illustrate the importance of building a stronger high school to college pathway.
The 2019 Washington Workforce and Education Investment Act was landmark legislation that improved access to higher education in Washington State. It intended to completely eliminate or reduce the tuition burden of attending college for low- and moderate-income students. However, tuition and fees are still higher in real dollars today than a decade ago. Additionally, some lower-income students still pay proportionately more tuition than students at the median income.
A different approach to improving college access is a College Promise program, which takes into consideration the geographic, racial/ethnic and income/wealth gaps in higher education. College Promise programs generally provide financial incentives in the form of fully or partially covered tuition and fees for particular groups of students who attend specified institutions of higher education.
They generally fall into two categories – first-dollar and last-dollar. First-dollar programs guarantee a grant that covers tuition and fees, allowing other forms of aid to be used to cover living costs. Last-dollar programs top off any remaining tuition and fees after applying other financial aid.
Beginning in rural Washington and other areas where the gaps intersect, a first-dollar College Promise would reduce barriers to access for students from a variety of backgrounds.
Washington’s Thriving Economy
Washington State has one of the fastest growing economies in the U.S. With strong STEM sectors, including aerospace, information and communications technology, clean technology, life sciences, and global health, Washington depends on a skilled and educated workforce.[1] Many additional careers from health care to construction also require post-secondary education and training. The Seattle-Tacoma-Bellevue metropolitan area ranks among the top 20 in the nation for the concentration of adults who have some higher education degree.[2] Despite having a strong high-school graduation rate, many Washington young adults do not continue to college. Interrelated opportunity gaps related to income, race, and geography often block their progress. Removing the tuition barrier and enacting tuition-free community college for all students could open up a clear pathway to college that will lead to higher individual educational attainment and community economic development.
Income and Wealth Gaps
Washington has a high degree of income inequality, which undermines equitable access to higher education.[3] Income and wealth are strong determinants of college-going. Student incomes and family wealth are extremely predictive of college interest and participation, as well as specific studies within college. Students from lower socioeconomic backgrounds are less likely than students from middle and higher socioeconomic backgrounds to pursue bachelor’s degrees.[4] Additionally, for many reasons, they are also more likely than students from higher socioeconomic backgrounds to attend less selective colleges, which have lower graduation rates.[5] Students from low socioeconomic backgrounds face several barriers to enrolling in and graduating from college. Many are first-generation college students, with less support available from parents in the college and financial aid application processes. Financial pressures mean they are more likely to drop out of college at higher rates – leaving them with debt to pay off, but not the higher salaries available to those who graduate.[6]
Racial and Ethnic Gaps
Black students, Latinx students, and Native Americans have lower educational outcomes and college-going rates than do white and Asian students. This is a result of systemic historical barriers, including explicit and implicit racial segregation and underfunding of K-12 and higher education. Studies analyzing differences in enrollment patterns indicate that first-time white students are more likely to enroll in four-year postsecondary institutions than first time Black students are.[7] Black and Latinx students are more likely to attend low-resource, high-poverty high schools than white and Asian students are, affecting their ability to complete the advanced classes and counseling that facilitate access to four-year colleges.[8] Additionally, Black students of all income levels are more likely than white students to require large student loans to meet expenses, and as a result, are disproportionately more likely to drop out of college because of tuition increases.[9]
Geographic Gaps
Rural counties, as defined by Washington’s Employment Security Department, include counties with a population density of less than 100 people per square mile.[10] Public high schools in rural counties in Washington State outperform other schools in on-time high school graduation. However, their graduates are less likely to start or complete a post-secondary degree than students in urbanized counties.
The school districts with the highest percentage of students continuing to college are all in urbanized – and relatively wealthy – areas of King County, while some rural school districts have fewer than 10 or 20 percent of high-school graduates going on to earn a higher education degree or certificate within eight years of graduation. The highest performing school district in the state is Mercer Island, where 74 percent of the class of 2009 earned a bachelor’s degree or higher within eight years of graduation.[11] In contrast, in the Port Angeles School District, approximately 53 percent of students in the class of 2009 earned no degree within eight years of high school. Similarly, 49 percent of the class of 2009 in the Aberdeen school district did not earn a degree within eight years of high school graduation.
The rural education gap is the result of several factors. For one, historically, many jobs in rural areas have been available to students directly out of high school. However, industries are changing and requiring higher levels of post-secondary education. Additionally, some rural high schools lack the advanced coursework to adequately prepare students for college.[12] Lastly, distance from and access to post-secondary institutions can be a barrier for many. This is particularly important for nontraditional students who have full-time jobs, childcare responsibilities, or who may be older. One study indicates that an additional three miles from home to the nearest college can drop enrollment by as much as 14 percent for non-traditional students.[13]
Case Studies
Much of Washington’s income and wealth is concentrated in urban and white communities, leaving communities of Color and rural communities with fewer resources to establish clear high school to college pathways. With a higher percentage of living-wage jobs now requiring post-secondary education, students of Color and rural students face yet another hurdle in keeping up with urban white students in the booming Puget Sound metropolis.
The following is an analysis of four counties – Grant County, Chelan County, Grays Harbor, and Pierce County – and the impact of the outlined gaps on the high school to college pipeline.
Grant County
Grant County is a rural county in Central Washington with a median income of $78,506 for a family of four in 2018.[14] Approximately 11 percent of the total population between 18 and 64 fell below the federal poverty level,[15] and 70 percent of all students in surrounding school districts qualified for free and reduced-price lunch.[16] The county has experienced slower net population growth rates than the rest of the state, while the Latinx population has been growing and now represents approximately 41 percent of total population.
Grant County’s overall economy has been on the path of recovery since the recession years of 2009 and 2010. Today, agriculture and the associated food processing industry continue to be fundamental components of the local economy. According to the Grant County Economic Development Council, the county’s farms annually produce crops and livestock valued at $1.19 billion. Food processing in the county is a $364 million industry, and makes up the largest proportion of manufacturing.[17] Grant County International Airport and easy access to Interstate 90 have attracted a variety of manufacturing companies, including chemical, steel and iron, and other manufacturers.[18] Additionally, Grant County is a hub for the aerospace industry, hosting Boeing and other aerospace companies.
The largest of these sectors, agriculture, provided 26.1 percent of all jobs in the county in 2017. Manufacturing provided about 12.4 percent, 42 percent of which were in food processing.[19] However, local government and health services tended to provide higher-wage jobs than agriculture and manufacturing. The growing Latinx population is largely left out of higher-paying and stable jobs.[20]
A plurality of high-school graduates do not enroll in college within a year of graduation in every school district in the county, with the exception of Warden School District. Among those students who do enroll in a post-secondary school, two-year institutions are much more popular than four-year colleges.
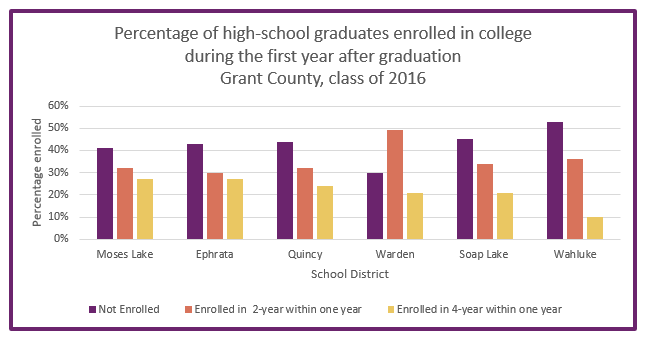
Figure 1. Source: Washington Education Research and Data Center, High-school Graduate Outcomes
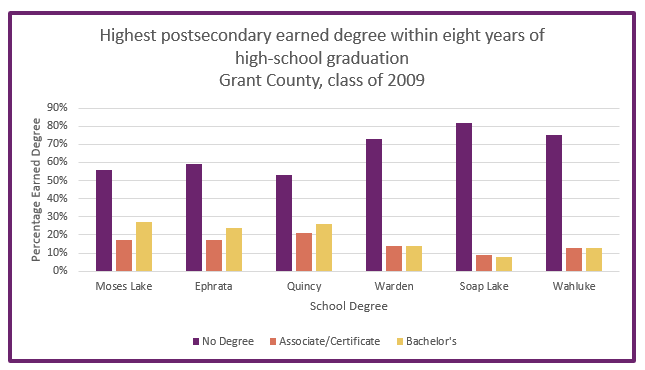
Figure 2. Source: Washington Education Research and Data Center, High-school Graduate Outcomes
Not all who matriculate after high school go on to earn a degree. A majority of the county’s high-school graduates have not earned a higher education degree or certificate eight years after high-school graduation. Over 80 percent of high school class of 2009 from the Soap Lake School District did not earn a degree at all. High school graduates from Moses Lake, Ephrata and Quincy all have higher bachelor’s degree than associate’s degree attainment, with approximately 20 to 30 percent of the class of 2009 earning a bachelor’s degree within eight years of high-school graduation.
Disparities become apparent when taking race and ethnicity into consideration. While Latinx students have a slight edge on white students in achieving an associate’s degree or certificate within eight years of high school, white students are far more likely to attain a bachelor’s degree. Latinx students face not only the income/wealth barriers, but also experience many additional institutional barriers.
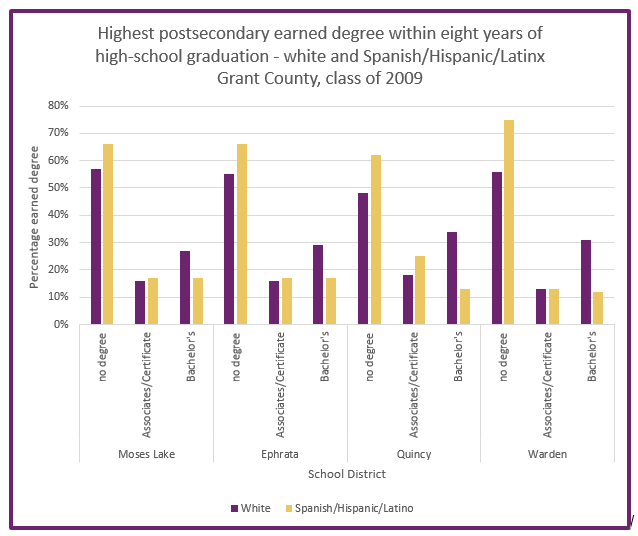
Figure 3. Source: Washington Education Research and Data Center, High-school Graduate Outcomes
Big Bend Community College and a co-located branch campus of Central Washington University (CWU) in Moses Lake are the primary institutions of higher education in the county. Additionally, CWU’s main campus is located in Ellensburg, 70 miles west of Moses Lake. White students make up around 50 percent of the total student population of Big Bend, while Latinx students make up around 35 percent of the student population, despite the fact that they make up a much greater proportion of high-school students.[21]
Big Bend Community College targets programming towards the major industries in the area. In addition to offering a transfer option in the arts and sciences for students on a bachelor’s-degree pathway, they also offer a catalogue of associate’s degrees and certificates in manufacturing, trades, and health care. These include programs in agriculture, welding, aviation maintenance, medical assistance, nursing, and early childhood education. These programs provide a strong stepping stool to the higher-paying industries in Grant County, in addition to enabling transfer to CWU for a four-year degree.
Chelan County
Chelan County in Central Washington is also largely rural and, like Grant County, has a median family income below the state’s. A four-person family in 2018 had a median income of $63,795.[22] Approximately 56 percent of students in Chelan’s school districts qualified for free- and reduced-price lunch.[23]
Similar to Grant County, Chelan County is facing slower overall population growth than the rest of the state, along with increases in the Latinx population, which accounts for 28.3 percent of its total population.[24] Chelan County’s economy depends primarily on agriculture, in addition to health services, retail, and leisure and hospitality. Approximately 24 percent of jobs are in agriculture, 14 percent in the health services, 10 percent in hospitality, and 10 percent in retail. The local government also provides a significant portion of jobs in the economy. Most recently, the loss of an Alcoa factory, a high-paying and significant portion of Chelan County’s economy, negatively impacted the manufacturing sector. As a result, nonfarm industrial activity has slowed down slightly. [25]
Chelan County is less diverse than Grant County. A higher percentage of students enroll in a four-year college within one year of high-school graduation and fewer students do not enroll in any college. A higher percentage of graduates also earn a bachelor’s degree than in Grant County. However, as in Grant County, more than half of high-school graduates earn no degree within eight years of high school graduation.

Figure 4. Source: Washington Education Research and Data Center, High-school Graduate Outcomes

Figure 5. Source: Washington Education Research and Data Center, High-school Graduate Outcomes
Approximately 13,306 students make up Chelan County’s school districts, of which 6,247 were Latinx and 6,552 were white in 2016.[26] While they are approximately equal in number and a majority of both groups do not complete any degree within eight years of graduation, white students still outperform Latinx students in educational attainment, particularly in completing a bachelor’s degree.
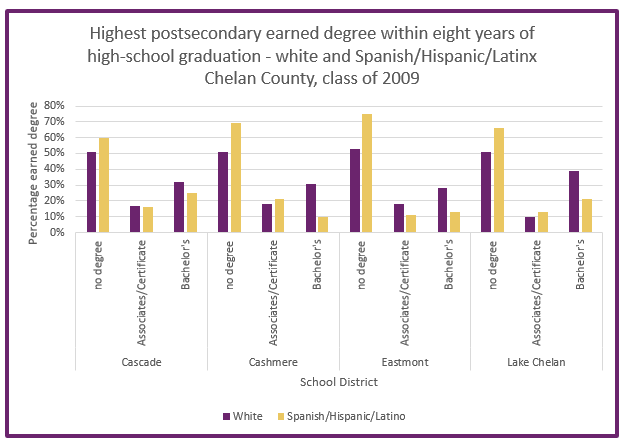
Figure 6. Source: Washington Education Research and Data Center, High-school Graduate Outcomes
Approximately 40 percent of the students of Wenatchee Valley Community College, the primary college that serves Chelan County, are Latinx.[27] Wenatchee Valley provides important agricultural courses specific to Latinx agricultural workers, including the Hispanic Orchard Employee Education Program (HOEEP) which is designed to further skills in agriculture. The college also provides a variety of courses in dominant industries, including retail management, outdoor recreation management, nursing, and other health and human-services courses. In addition to Wenatchee Valley, Central Washington University has a branch campus in Wenatchee, offering some social sciences and education degrees.
Grays Harbor County
Grays Harbor is a rural county on the coast in Western Washington, with a median income for a family of four of $62,763 in 2018.[28] In that year, 17.5 percent of all families had an income that put them below the federal poverty level.[29] Approximately 67 percent of students in Grays Harbor qualify for the free and reduced-price lunch program. It also is facing a slightly slower population growth than the rest of Washington. However, unlike Chelan and Grant Counties, Grays Harbor is less diverse than the rest of the state and nation. In 2018, nearly 87.4 percent of the total population was counted as white.[30]
In general, the majority of Grays Harbor workers are employed in service-providing industries, such as state and local government, trade, transportation, utilities, education, and health services. These sectors account for approximately 83.3 percent of all jobs in Grays Harbor County. Unlike Grant County and Chelan County, Grays Harbor’s economy is not reliant on agriculture. The highest-paying industries are mining, quarrying, and oil and gas extraction as well as information and technology.
Grays Harbor resembles Grant County in median family income and has similar rates of enrollment in two-year institutions one year after high-school graduation. However, Grays Harbor has lower rates of enrollment in four-year institutions than Grant County. Within eight years of high-school graduation, a greater percentage of students in Grays Harbor have no degree than those in Grant County.

Figure 7. Source: Washington Education Research and Data Center, High-school Graduate Outcomes
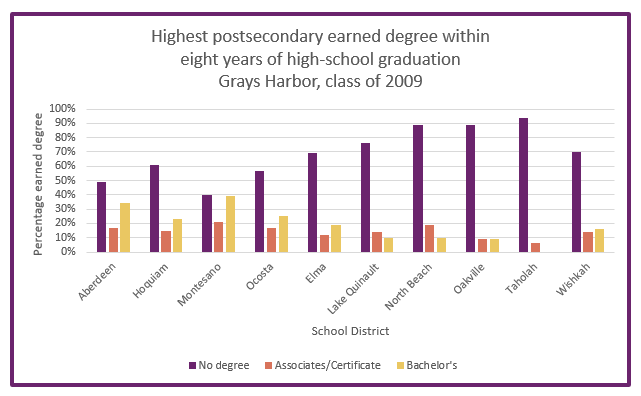
Figure 8. Source: Washington Education Research and Data Center, High-school Graduate Outcomes
Unlike in Chelan and Grant Counties, where Central Washington University has branch campuses alongside the local community colleges, Grays Harbor County has only one community college that serves the area, Grays Harbor College. Grays Harbor College has three campuses in Grays Harbor and Pacific Counties. Each of these campuses offer a variety of course concentrations, including bachelor of applied science degrees in organizational management, forest resource management and teacher education. Additionally, they offer associate’s degrees in the higher-paying sectors of Grays Harbor, including technology and health sciences. Lastly, they offer direct-transfer degrees to four-year colleges in other parts of the state, which enable seamless transitions.[31]
Pierce County
Pierce County has a higher median family income than the three rural counties highlighted here. The median income for a family of four was $90,730 in 2018.[32] Approximately 45 percent of K-12 students qualified for free or reduced-price lunch in the 2018-2019 academic year.[33] The county also differs in population and economic growth. Pierce County has experienced increases in population that match the state’s growth rate.[34] It is also more racially diverse: approximately 7.5 percent of total population is Black, 10.9 percent is Latinx, 8.4 percent are Asian/native Hawaiian/Pacific Islander, and 75.2 percent is white.
Pierce County is part of the booming Puget Sound regional economy. Tacoma is the third largest city in the state. The largest employment sector in Pierce County is in healthcare. The United States Military is another major employer, with Joint Base Lewis-McChord located in Pierce County. Various other government agencies are also large employers in Pierce County. As a port city, port related industries, such as shipping and railroads, and the Port of Tacoma itself are also major employers.[35]
Despite this urban and larger economy, many Pierce County school districts are similar to rural school districts in terms of college enrollment. Similar percentages of students do not enroll in college within a year of high-school graduation, but more students enroll in four-year colleges. The number of available four-year colleges within Pierce and adjacent counties likely contribute to this higher enrollment. Slightly more students in some of the school districts also enroll in two-year colleges. Within eight years of high-school graduation, more students also gained an associate’s degree, and a significantly larger proportion of students gained a bachelor’s degree than in the three rural counties.
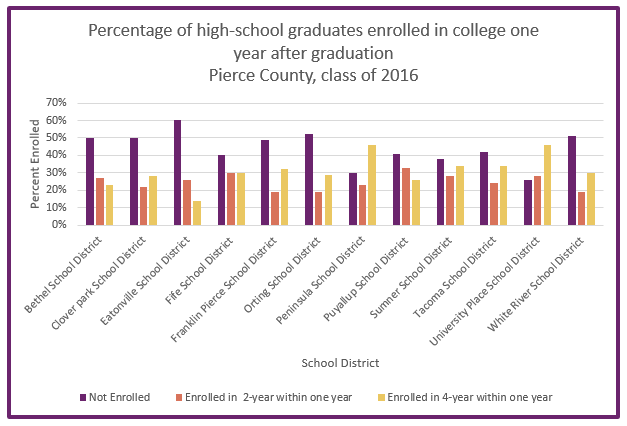
Figure 9. Source: Washington Education Research and Data Center, High-school Graduate Outcomes
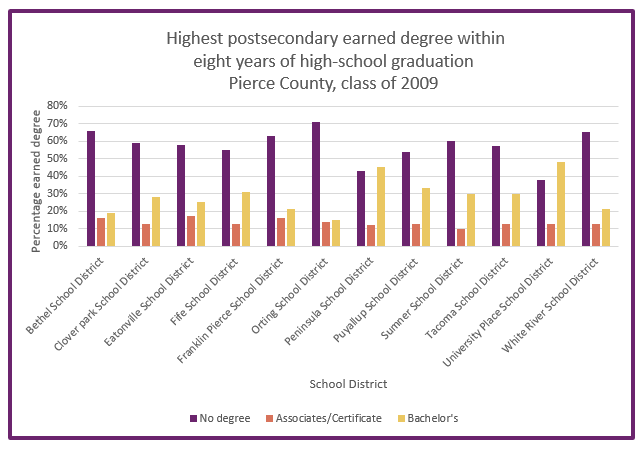
Figure 10. Source: WA Education Research and Data Center, High-school Graduate Outcomes
However, this higher attainment is not distributed equally. A greater proportion of white students achieve a bachelor’s degree within eight years of high school than Black students. Similarly, a greater proportion of Black students earn no degree at all within eight years of high-school graduation than white students. Black students typically have lower incomes and much less family wealth, compounding structural and historical barriers that have diminished educational attainment.
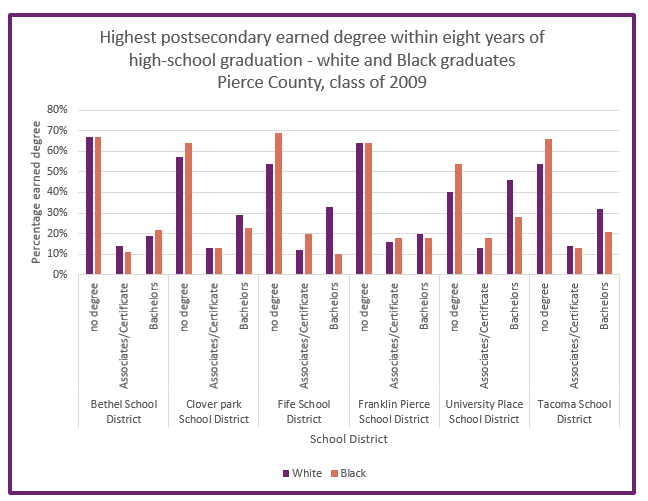
Figure 11. Source: WA Education Research and Data Center, High-school Graduate Outcomes
With a higher density of colleges available, including two- and four-year private and public colleges, high-school graduates in Pierce County should be well-equipped to participate as students in higher education. However, with a greater proportion of students of Color and low-income students, historical barriers continue to persist in keeping students from college.
Washington’s Progress toward Equitable Access to Higher Education
College Promise programs have gained popularity across the country as a way to increase the number of high-school students going on to college, reduce disparities in access to higher education, and promote local economic development. Programs vary, but generally provide financial incentives in the form of fully or partially covered tuition and fees for particular groups of students who attend specified institutions of higher education.
They often fall into one of two categories. First-dollar programs guarantee a base grant sufficient to cover tuition and fees. Last-dollar programs top off remaining tuition and fees after applying other financial aid. Some Promise programs also include income, merit, age, and residency, restrictions. Washington State has also implemented Promise-style programs. The major statewide programs are detailed below.
The Washington College Grant (WCG)
In 2019, the Washington Legislature approved the Workforce Education Investment Act (WEIA) that will extend free tuition to students with family incomes below 55 percent of the state median family income and reduced tuition for students in families with up to 100 percent of median family income. Students are able to enroll at any of the eligible universities and colleges for five years or 135 percent of the length of their program. Until 2020-21, students’ families must have an income at or below 70 percent of the median family income to be eligible. Students under the age of 24 who had been in foster care are also eligible. Beginning in the 2020-21 academic year, students at or below 100 percent of the median family income will also qualify for a percentage of the maximum award. The maximum awards will vary by income. The WEIA also raised taxes on certain businesses that benefit from and require a highly educated workforce, allowing the Washington College Grant to be an entitlement to all eligible students.
Income Eligibility and Maximum Awards from Washington College Grant, 2020-2021
| % of Median Family Income | Maximum Income (family of four) |
% of Maximum Award |
| 0-50% | $46,000 | 100% |
| 51-55% | $50,500 | 70% |
| 56-60% | $55,000 | 65% |
| 61-65% (College Bound max) | $59,500 | 60% |
| 66-70% | $64,000 | 50% |
| 71-75% | $69,000 | 24.5% |
| 76-100% ($92,000 max) | $92,000 max | 10% |
Figure 12. Source: Washington Student Achievement Council
The State Need Grant
The predecessor of the Washington College Grant, the State Need Grant, was established in 1969 and granted awards to students with families below 70 percent of the median income.
The Washington Student Achievement Council and the Washington State Institute for Public Policy have both been tracking the outcomes of the State Need Grant. They analyzed student records of 40 public higher education institutions and 17 private colleges and universities over eight years (2004-5 to 2011-12).[36]
State Need Grant students who enrolled at community and technical colleges tended to be older, had dependents and enrolled on a part-time basis. Students who enrolled at four-year institutions, on the other hand, tended to resemble “traditional” college students and were more likely to be recent high-school graduates.
State Need Grant recipients were likely to persist year-to-year at high rates. Approximately 30 percent of all community and technical college students completed their awards within four years, of which about 40 percent were enrolled part-time. Students enrolled at four-year institutions completed their degrees in an average of 4.5 years.
Unfortunately, the State Need Grant was never sufficiently funded to cover all students who were otherwise eligible. The Washington Student Achievement Council conducted a survey of students who were eligible and received the grant in 2011-12, but did not receive the grant the following school year. In response, some students had to borrow more money, which caused anxiety about their ability to repay the loans following graduation. Other students adjusted their lifestyles, by taking on more hours at work, working more jobs, adding roommates, eating less, or living in their cars. Academically, some students took fewer credits and opted to go without textbooks. All of these adjustments diminished their abilities to effectively attend and complete college.[37]
The College Bound Scholarship
The College Bound Scholarship (CBS), implemented in the 2007-08 academic year, is an early commitment, need-based program. Students can use the scholarship at any two- or four-year college. The College Bound scholarship provides full tuition and an additional $500 book stipend to all participants. This aid for College Bound Scholars is built on top of the State Need Grant and the program replacing it, Washington College Grant.
Applying for the scholarship is a two-step process. In 7th or 8th grade, students who participate in a free or reduced-price lunch program, have a family income that would qualify them for the program, receive TANF or SNAP benefits, or are in foster care, must sign a pledge to be eligible for the scholarship. They pledge that they will graduate from a Washington high school with a minimum 2.0 GPA and no felony convictions, and file their FAFSA or WAFSA scholarship application forms.
To receive the scholarship, College Bound students must demonstrate that they have fulfilled their pledge and have a family income at or below 65 percent of the state MFI at the time of their graduation. Students can then use their scholarship at an eligible undergraduate program by fall term within one year of graduation, and may use no more than four academic years of funding.
Two of the goals of the College Bound Scholarship are to encourage good behavior and to incentivize students to work hard at school. Studies indicate that College Bound has some positive effect on on-time graduation, GPA,[38] and felony convictions,[39] though the results are mixed. Additionally, some studies find that receiving the College Bound scholarship had positive effects on four-year degree completion and cumulative credits attempted.[40]
Students who signed the pledge were more likely to be female and Latinx and less likely to be white. Relative to Latinx students, Black students, Asian students, and multiracial students, Native American students were less likely to sign the pledge.[41] Students in Eastern Washington signed up at higher rates than students in Western Washington did. College enrollment rates among those that sign the pledge are similar.[42]
The Missing Links
The Washington College Grant and College Bound Scholarships work together to reduce the burden of tuition and fees for low-income students. These programs have prioritized students who need state funds the most. With the expansions of the Washington College Grant, students up to the median family income now qualify, too. However, even with these expansions, tuition is higher at universities and colleges today than a decade ago, adjusted for inflation, and the cost as a percentage of median family income has fallen only slightly.
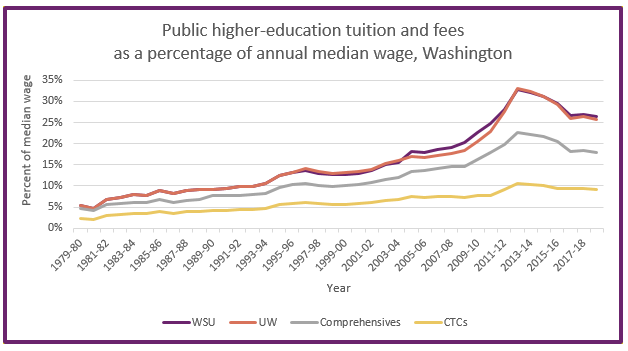
Figure 13. Sources: Washington Student Achievement Council, Office of Financial Management, LEAP Committee, State Board of Community and Technical Colleges. Median Wage: Economic Policy Institute analysis of Current Population Survey data (assumes 40 hours of work per week).
Tuition and fees for families between 55 and 70 percent of median family income (MFI) will still be higher in 2020 with the expansion of the Washington College Grant than they were in 2001. Families at MFI will still be paying more for tuition than they did in 2010. Additionally, as a percentage of total income, students between 75 and 90 percent of state median income will pay more towards tuition and fees than students between 95 and 100 percent of the median family income. This is a result of the structure of the Washington College Grant. Families with incomes between 75 and 100 percent of state median income all receive 10 percent of the maximum award causing families on the lower end to pay a greater percentage of income towards tuition than families closer to the median family income.[43]
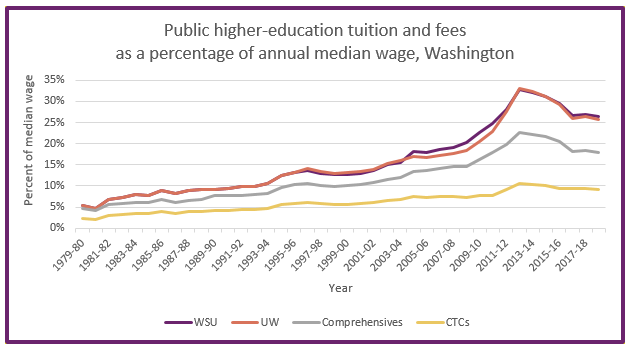
Figure 14. Sources: Washington Department of Social and Health Services, Census Data, Washington Student Achievement Council, Washington Office of Financial Management, Washington State LEAP Committee, University of Washington
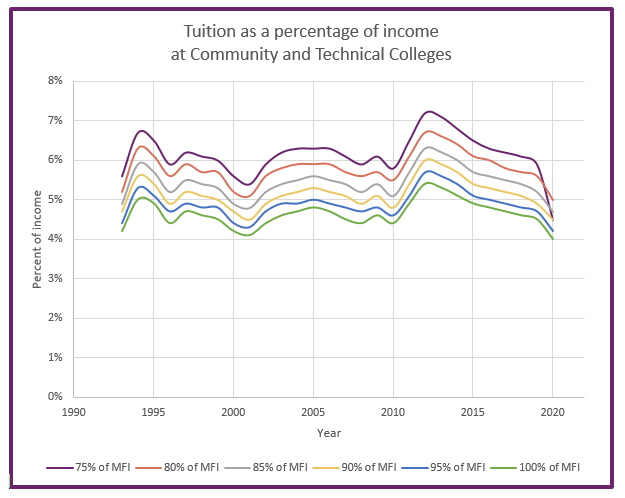
Figure 15. Sources: Washington Department of Social and Health Services, Census Data, Washington Student Achievement Council, Washington Office of Financial Management, Washington State LEAP Committee, Washington State Board of Community and Technical Colleges
This grant structure results in less equitable outcomes, with lower- and middle-income families paying a greater share of their income towards tuition than families at the median or above. Many families in rural counties will fall into this category. Moreover, students in families with incomes just above the median can also struggle to cover college costs, especially as costs for housing and other essential living costs escalate.
Washington State’s decades-long disinvestment from higher education has transferred the burden of tuition to students and their families over time. Support through programs such as the Washington College Grant and College Bound are one way to address the cost burden, particularly on students from low- income backgrounds. These programs are not enough, however, to address disparities in access and the growing cost burden on moderate-income families.[44]
Is College Promise the Missing Piece?
Thoughtfully designed College Promise programs address some of these issues. They provide greater certainty for students and a clearer, simpler, and more accessible pathway to certificate programs and degrees, while addressing the need for a more educated and trained workforce locally. They provide opportunity for those who would have otherwise not considered college for reasons including their age, distance, and generational experience with higher education. They additionally remove income cliffs and other barriers to college access.
A College Promise program would require some important elements:
- Inclusive post-secondary education options: The program should be open to programs that include apprenticeships in addition to more traditional programs. This includes students who would like to gain further skills for employment and students who would like to continue on to four-year institutions.
- First-dollar: The program should be a first-dollar program so that the benefits do not simply replace other grants and disadvantage low-income students, who also need support for basic living expenses.
- Mentorship: The program should include a mentorship, particularly for first-generation and immigrant students who do not have the social capital to tackle the college application process. Additionally, the mentors can guide students through completion of their programs and the four-year college application process.
- Expansive time and age limits: The program should be open to all students, regardless of age, and accommodate students whose circumstances may require taking longer to graduate. Age and time restrictions are harmful for students with family responsibilities and nontraditional students.
One approach to launching a more comprehensive Promise program would be to pilot it in targeted community colleges in rural Washington and other communities in which the income, racial, and geographic gaps intersect to reduce educational attainment. In addition to enabling educational attainment, this approach, by increasing human capital, would also encourage economic development and entrepreneurship in areas where economic growth has been slower than in urban areas. A strong Promise program will likely make the ladder towards a higher-paying job less expensive and less complicated.
Conclusion
Washington State is home to a booming STEM sector that requires a well-educated workforce, but the economic expansion has also exacerbated inequities. In the high school to college pathway, geographic, income, and racial/ethnic gaps intersect and pose barriers for students the most in need. Washington State has made some strides in reducing the barriers to access through the Workforce and Education Investment Act of 2019, but more work still needs to be done. Tuition-free community college with no income, age, or residency requirements can be the next step in removing access barriers across race, income, and geography, while promoting economic development in economically distressed areas through workforce development.
Endnotes
[1] “Key Industries in Washington State” The Washington State Department of Commerce https://www.commerce.wa.gov/growing-the-economy/key-sectors/
[2] “Educational Attainment for All: Diversity and Equity in Washington State Higher Education” The Washington Student Achievement Council, July. 2013. https://www.wsac.wa.gov/sites/default/files/DiversityReport.FINAL.Revised.07-2013_0.pdf
[3] Estelle Sommeiller and Mark Price, “The New Gilded Age,” Economic Policy Institute, July 2018, https://www.epi.org/publication/the-new-gilded-age-income-inequality-in-the-u-s-by-state-metropolitan-area-and-county/
[4] Berman, Jillian. “More low-income students are attending college, but they’re still playing catch-up on their wealthier peers” MarketWatch, 23, May. 2919, https://www.marketwatch.com/story/more-low-income-students-are-attending-college-but-theyre-still-playing-catch-up-on-their-wealthier-peers-2019-05-23
[5] Berman, Jillian. “More low-income students are attending college, but they’re still playing catch-up on their wealthier peers” MarketWatch, 23, May. 2919, https://www.marketwatch.com/story/more-low-income-students-are-attending-college-but-theyre-still-playing-catch-up-on-their-wealthier-peers-2019-05-23
[6] “Addressing the College Completion Gap among Low-Income Students” College for America. 7, Jun. 2017 https://collegeforamerica.org/college-completion-low-income-students/
[7] Ross, Janell “Why do Most Black and Latino Students go to Two-Year Colleges?” The Atlantic. 22, May. 2014 https://www.theatlantic.com/education/archive/2014/05/why-do-a-majority-of-black-and-latino-students-end-up-at-two-year-colleges/371423/
[8] Adelman, Clifford “Answers in the tool box: Academic Intensity, Attendance Patterns, and Bachelor’s degree attainment” U.S Department of Education. Jun. 1999 https://www2.ed.gov/pubs/Toolbox/toolbox.html
[9] Heller, Donald E. “Student Price Response in Higher Education: An Update to Leslie and Brinkman.” The Journal of Higher Education, vol. 68, no. 6, 1997, pp. 624–659.
[10] Urban vs Rural. Employment Security Department, November 2017, https://esdorchardstorage.blob.core.windows.net/esdwa/Default/ESDWAGOV/labor-market-info/Flyers-brochures/Urban%20vs%20Rural%20Brochure%2011%20x%2017_SV.pdf
[11] Office of Financial Management; Education Research and Data Center High School Graduation Outcomes https://erdc.wa.gov/data-dashboards/high-school-graduate-outcomes
[12] Keating, Aaron. “Public Higher Education Tuition in Washington. State Budget cuts have pushed the cost of college out of reach” Economic Opportunity Institute. 15, August. 2019. https://www.opportunityinstitute.org/research/post/public-higher-education-tuition-in-washington/
[13] Jepsen, Christopher, and Mark Montgomery. “Miles to Go before I Learn: The Effect of Travel Distance on the Mature Person’s Choice of a Community College.” Journal of Urban Economics, vol. 65, no. 1, 2009, pp. 64–73.
[14] U.S. Census Bureau; American Community Survey, 2018 American Community Survey 1-year estimate, Table S1903; using data.census.gov https://data.census.gov/cedsci/table?q=S1903&g=&hidePreview=false&table=S1903&tid=ACSST1Y2018.S1903&vintage=2018&lastDisplayedRow=26&mode=
[15] U.S. Census Bureau; American Community Survey, 2018 American Community Survey 1-year estimate, Table S1701; using data.census.gov https://data.census.gov/cedsci/table?q=S1903&g=&hidePreview=false&table=S1701&tid=ACSST1Y2018.S1701&vintage=2018&lastDisplayedRow=26&mode=
[16] Office of the Superintendent of Public Instruction, 2018-19 Washington National School Lunch Program – Free and Reduced Enrollment by Public School in County/District order; using OSPI data portal. 31, October. 2018
[17] Meseck, Don. “Grays Harbor County Profile” Employment Security Department. February. 2019.
https://esd.wa.gov/labormarketinfo/county-profiles/grant
[18] “Grant County Economic Development Council” Grant County Economic Development Council
[19] Meseck, Don. “Grays Harbor County Profile” Employment Security Department. February. 2019.
https://esd.wa.gov/labormarketinfo/county-profiles/grant
[20] “Grant County, Washington” Data USA. https://datausa.io/profile/geo/grant-county-wa/
[21] “Big Bend Community College” Data USA. https://datausa.io/profile/university/big-bend-community-college
[22] U.S. Census Bureau; American Community Survey, 2018 American Community Survey 1-year estimate, Table S1903; using data.census.gov https://data.census.gov/cedsci/table?q=S1903&g=&hidePreview=false&table=S1903&tid=ACSST1Y2018.S1903&vintage=2018&lastDisplayedRow=26&mode=
[23] Office of the Superintendent of Public Instruction, 2018-19 Washington National School Lunch Program – Free and Reduced Enrollment by Public School in County/District order; using OSPI data portal. 31, October. 2018
[24] https://www.census.gov/quickfacts/fact/table/chelancountywashington,grantcountywashington/PST045218
[25] Meseck, Don. “Chelan and Douglas Count Profiles” Employment Security Department. November. 2018. https://esd.wa.gov/labormarketinfo/county-profiles/chelan-douglas
[26] Office of Superintendent of Public Instruction, Count of Students by County with grade, race, ethnicity, and gender; using OSPI data porta. 1, Oct. 2017.
[27] “Wenatchee Valley College” Data USA. https://datausa.io/profile/university/wenatchee-valley-college
[28] U.S. Census Bureau; American Community Survey, 2018 American Community Survey 1-year estimate, Table S1903; using data.census.gov https://data.census.gov/cedsci/table?q=S1903&g=&hidePreview=false&table=S1903&tid=ACSST1Y2018.S1903&vintage=2018&lastDisplayedRow=26&mode=
[29] U.S. Census Bureau; American Community Survey, 2018 American Community Survey 1-year estimate, Table S1701; using data.census.gov https://data.census.gov/cedsci/table?q=S1903&g=&hidePreview=false&table=S1701&tid=ACSST1Y2018.S1701&vintage=2018&lastDisplayedRow=26&mode=
[30] Vleming, Jim. “Grays Harbor County Profile” Employment Security Department. April. 2019. https://esd.wa.gov/labormarketinfo/county-profiles/grays-harbor#population
[31] “Degrees and Certificates” Grays Harbor Community College. https://www.ghc.edu/academics/degrees-and-certificates
[32] U.S. Census Bureau; American Community Survey, 2018 American Community Survey 1-year estimate, Table S1903; using data.census.gov https://data.census.gov/cedsci/table?q=S1903&g=&hidePreview=false&table=S1903&tid=ACSST1Y2018.S1903&vintage=2018&lastDisplayedRow=26&mode=
[33] Office of the Superintendent of Public Instruction, 2018-19 Washington National School Lunch Program – Free and Reduced Enrollment by Public School in County/District order; using OSPI data portal. 31, October. 2018
[34] Vleming, Jim. “Pierce County Profile” Employment Security Department. April. 2019. https://esd.wa.gov/labormarketinfo/county-profiles/pierce
[35] Vleming, Jim. “Pierce County Profile” Employment Security Department. April. 2019. https://esd.wa.gov/labormarketinfo/county-profiles/pierce
[36] Bania, N., Burley, M., & Pennucci, A. (2013). The effectiveness of the state need grant program: Final evaluation. (Doc. No. 14-01-2301). Olympia: Washington State Institute for Public Policy.
[37] “Fall 2013 State Need Grant Survey: Final Report” 2014 https://wsac.wa.gov/sites/default/files/2014.03.04.SNGUnservedReport.FINAL.pdf
[38] Goldhaber, D, et al. National Center for Analysis of Longitudinal Data in Education Research (CALDER), 2017, pp. National Center for Analysis of Longitudinal Data in Education Research (CALDER).
[39] Fumia, D., Bitney, K., & Hirsch, M. (2018). The effectiveness of Washington’s College Bound Scholarship program (Document Number 18- 12-2301). Olympia: Washington State Institute for Public Policy
[40] Long, M., Goldhaber, D., & Gratz, T. (2019). Washington’s College Bound Scholarship Program and its Effect on College Entry, Persistence, and Completion. CEDR Work Paper No. 09102019-1- 1. University of Washington, Seattle, WA.
[41] Goldhaber, Dan, et al. “Sign Me Up: The Factors Predicting Students’ Enrollment in an Early-Commitment Scholarship Program.” AERA Open, vol. 5, no. 2, 2019, pp. AERA Open, June 2019, Vol.5(2).
[42] ibid
[43] Ibid
[44] ibid
More To Read
Higher Education
September 6, 2024
Tax loopholes for big tech are costing Washington families
Subsidies for big corporations in our tax code come at a cost for college students and their families
Higher Education
April 4, 2024
Is There a Valid Argument Against Cost-Free College in Washington?
Cost-free college is a meaningful investment that would change lives. What's stopping Washington from making it happen?
Higher Education
October 20, 2022
Biden’s Student Loan Forgiveness is A Necessary Step in the Right Direction
Student loan forgiveness will provide immediate psychological, and material benefits for borrowers and their communities.