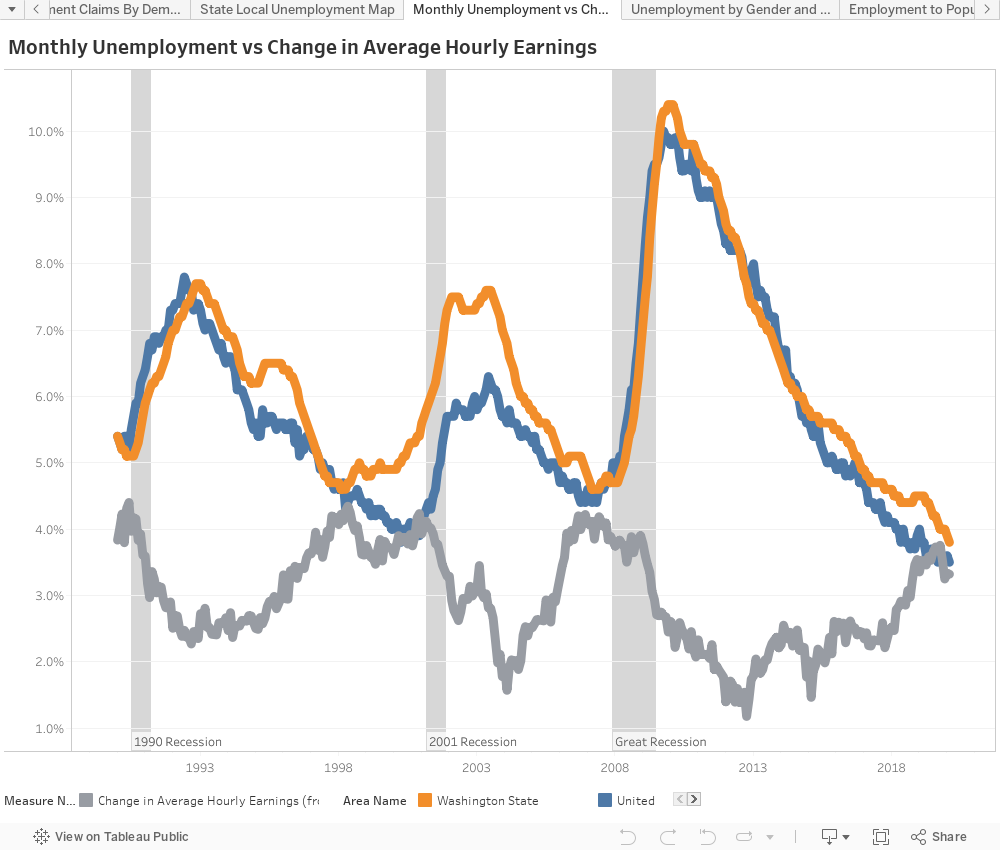
Washington’s unemployment rate continues to improve, hitting a historic low of 4.4 percent this August. Wage growth for most workers, however, is modest at best. One might expect that a competitive job market would fill workers’ paychecks. What gives?
Prior to the Great Recession, when unemployment dropped this low, hourly earnings for non-managers increased 4 percent (or more) over the year prior. But in August 2018, earnings were up just 2.6 percent. Does a 1.4 percentage point gap not sound like much? It’s equivalent to about $580 million that is not in workers’ pockets – and that’s in one quarter of 2018 alone.

To understand why wages aren’t rising, let’s peer under the hood of the official unemployment rate. It counts people who don’t have jobs and have actively looked for work in the past month. That’s a sensible approach, in that there are people whom you wouldn’t want to count as unemployed even though they aren’t working – such as full-time students, a parent who wants to stay at home, etc.
But its drawback is that it excludes many people who might actually like a job (or would take one if it came along) but who haven’t been looking. During the Great Recession, many would-be job seekers became disparaged and stopped their searches — students who found it difficult to get interviews, middle-age workers who were laid off couldn’t get another gig, and older workers who retired early.
The official unemployment rate doesn’t count them as unemployed, so it’s not a very good way to measure how much “slack” is out there – that is, potential workers still sitting at home. From a labor market point of view, less slack means a tighter labor market, and all else equal that means more upward pressure on wages. More slack in the labor market creates the opposite result.
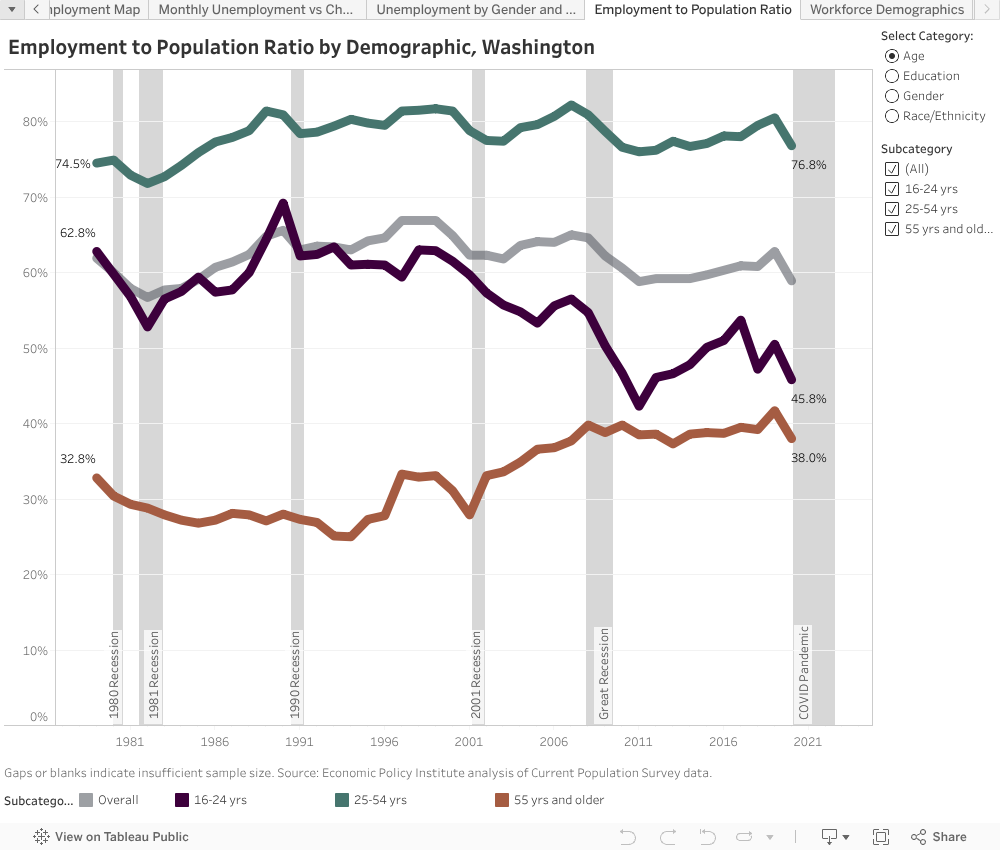
Where can we get a better measure of slack? By using the working-age employment rate, or as economists like to call it, the “prime age employment to population ratio.” Put simply, this figure tells you what percentage of people age 25 to 54 (i.e., the people one would think are most likely to be working) actually have a job.
Since the late 1980’s, employment for 25 to 54 year olds has peaked at 82 percent prior to every recession. But as of 2017 (the latest data available), just 78 percent of prime-age workers are employed. We’re missing 4 percent of our prime-age workforce. And with 2.9 million people in that demographic, that’s roughly 116,000 people who you’d expect to have jobs who still aren’t working.
That’s the slack. That means there are people waiting in the sidelines for jobs, making the market less competitive than it seems.

But the working age employment rate isn’t the only way to understand why wages aren’t rising. The underemployment rate is also an illuminating statistic.
The underemployment rate (U-6) includes everyone in the traditional unemployment rate, plus:
- Discouraged workers (those who have stopped looking for work due to current economic conditions);
- Marginally attached workers (those who would like and are able to work, but have not looked for work recently); and
- Involuntary part-time workers (persons employed less than 35 hours/week but who want, and are available for, full-time work).
Take a look at how Washington measures up. The Great Recession cut deeply in the bone of the state’s labor market – and today, the state’s underemployment rate is still roughly double the unemployment rate, and behind the national average.


Taken together, the state’s working-age employment rate and underemployment rate tell us one thing: there are still a lot of Washington residents who could use a job – or a better job. And it’s likely that explains why wage growth hasn’t taken off, even as unemployment has reached such lows.
Note: Graphs in this post may be updated after publication to reflect current data.
More To Read
State of Working Washington
August 10, 2021
New State Programs May Ease a Short-Term Evictions Crisis, but Steep Rent Hikes Spell Trouble
State and local lawmakers must fashion new policies to reshape our housing market
State of Working Washington
November 20, 2020
We Can Invest in Us
Progressive Revenue to Advance Racial Equity
Amy Hagopian
Wow, great analysis. And interactive, too! Love it!
Oct 21 2018 at 3:25 AM