Recent increases in consumer prices are real and significant. But while the Consumer Price Index (CPI) tells us how much prices have changed over time, it doesn’t tell us much about the factors underlying those increases. One factor that hasn’t received enough attention is how the pricing power – and higher profits – of corporations is driving inflation.
Compounded by the minimal-to-modest wage gains made by most workers over the past two decades, price increases – both recent and long-term – are making it increasingly difficult for workers and families to rebuild and maintain economic security in the wake of the economic losses and continued uncertainty brought on by the pandemic.
The Consumer Price Index for All Urban Consumers (CPI-U) increased 6.8% for the 12 months preceding November 2021. A substantial portion of the overall increase is attributable energy (+33.5%) and food (6.4%) prices, both of which are historically quite volatile. Prices for all items less food and energy rose 4.9%; rent and medical care costs rose less than overall inflation, at 3.0% and 1.7%, respectively.[i]
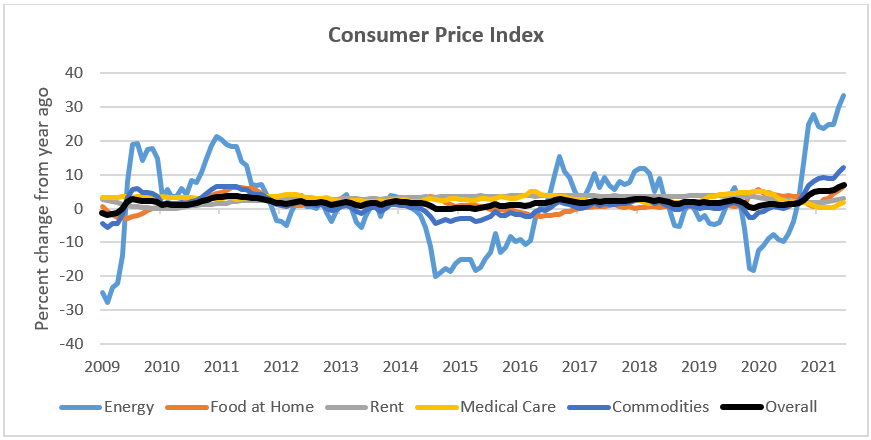
Source: U.S. Bureau of Labor Statistics
The CPI compares prices for a “basket” of typical consumer goods and services, in order to calculate how prices change over time – but it doesn’t explain the price increases themselves.
Tangled shipping and transportation lines, along with workforce scarcity in many service professions, has gotten a lot of attention. But Matt Stoller, who writes on the history and politics of monopoly power, recently called out another significant factor driving price increases: corporate profit margins – which are at a 70-year record high.
Stoller calculates that corporate profits have driven as much as 60% of recent inflation increases – costing Americans more than $2,100 each since the pandemic began:
Just before the pandemic, in 2019, American non-financial corporations made about a trillion dollars a year in profit, give or take. This amount had remained constant since 2012. Today, these same firms are making about $1.73 trillion a year. That means that for every American man, woman and child in the U.S., corporate America used to make about $3,081, and today corporate America makes about $5,207. That’s an increase of $2,126 per person.
It bears noting that even in the years leading up to the COVID pandemic – when inflation wasn’t grabbing headlines – Washington’s families were still being squeezed by rising prices on one side, and wages that failed to keep up on the other.
Over the past two decades, costs for crucial goods and services like child care, rent, and health care have taken a larger share of workers’ incomes – leaving people with fewer resources to plan for the future and prepare for emergencies. Even adjusted for overall inflation, child care, rent, and health insurance premiums are taking up a greater share of workers’ earnings each year.
Yearly Cost of Child Care (Washington average)
| Percent of WA Median Wage | Yearly Cost (inflation-adjusted) | ||||||
| Age Group | Care Type | 2000 | 2019 | Change | 2000 | 2019 | Change |
| Infant | Family Care | 18.3% | 20.4% | +2.1 | $8628 | $11,178 | +$2550 |
| Licensed Center | 24.2% | 26.8% | +2.6 | $11,413 | $14,713 | +$3300 | |
| Toddler | Family Care | 17.1% | 18.6% | +1.5 | $8031 | $10,206 | +$2175 |
| Licensed Center | 20.7% | 23.1% | +2.3 | $9767 | $12,636 | +$2868 | |
| Preschooler | Family Care | 16.3% | 16.8% | +0.5 | $7687 | $9210 | +$1522 |
| Licensed Center | 18.2% | 20.5% | +2.2 | $8592 | $11,214 | +$2623 | |
| School Age | Family Care | 8.3% | 9.6% | +1.3 | $3925 | $5261 | +$1336 |
| Licensed Center | 10.3% | 12.2% | +1.9 | $4866 | $6682 | +$1817 | |
Source: Kids Count Data Center
Monthly Cost of Fair Market Rent (2-bedroom residence)
| Number of work hours required at local median wage to pay | Cost (inflation-adjusted) | |||||
| Area | 2006 | 2020 | Change | 2006 | 2020 | Change |
| Washington | 34.5 | 36.2 | +1.7 | $829 | $1,069 | $240 |
| Benton County Metro | 33.0 | 40.3 | +7.3 | $804 | $1,089 | $285 |
| Clallam County | 37.2 | 46.2 | +9.0 | $767 | $1,041 | $274 |
| Clark County Metro | 41.8 | 56.8 | +14.9 | $930 | $1,495 | $565 |
| Franklin County Metro | 45.9 | 53.3 | +7.4 | $804 | $1,089 | $285 |
| Island County | 41.0 | 48.8 | +7.8 | $838 | $1,139 | $301 |
| King County Metro | 37.7 | 54.0 | +16.3 | $1,081 | $2,099 | $1,018 |
| Kitsap County Metro | 46.9 | 53.8 | +6.9 | $987 | $1,296 | $309 |
| Pierce County Metro | 43.8 | 53.2 | +9.4 | $996 | $1,408 | $412 |
| Snohomish County Metro | 42.6 | 69.9 | +27.3 | $1,081 | $2,099 | $1,018 |
| Spokane County Metro | 39.5 | 37.7 | -1.7 | $816 | $910 | $94 |
Source: RentData.org, based on U.S. Department of Housing and Urban Development (HUD) publications. Note: Fair Market Rent is defined by HUD as the 40th percentile of typical rentals in a given region.
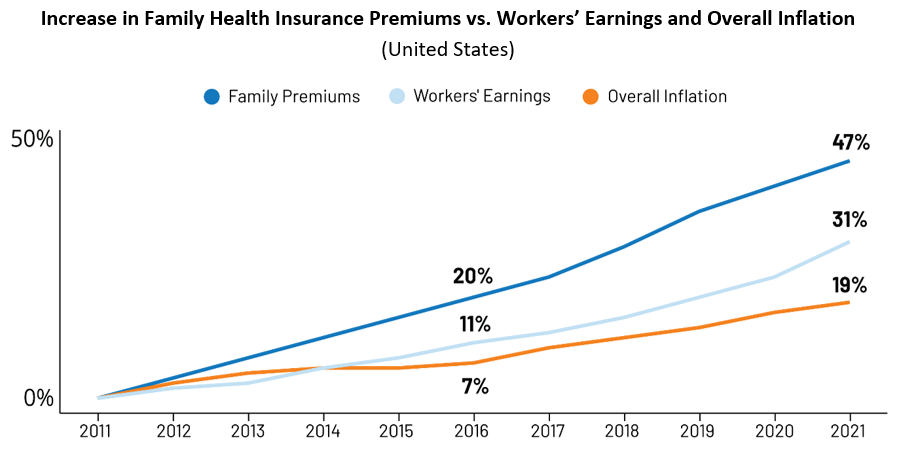
Source: Kaiser Family Fund, Health Benefits Survey 2021
Next Steps for Policymakers
Our economy is created and defined by the public policies we enact and enforce around it. The Build Back Better bill – which having passed the House, now needs to pass the Senate before heading to President Biden’s desk for signature – includes several provisions aimed at shoring up economic stability and resilience for low- and middle-income households, including:
- Help paying for child care,
- Providing states with funding to create a free pre-K system for 3- and 4-year-olds,
- A beefed-up child tax credit that would sharply reduce childhood poverty, and
- An expanded earned income tax credit
- Provisions aimed at reducing the cost of health care for working families and retirees
In Washington state, legislators need to make public investments now that will strengthen the core pillars of our economy – including child care, health care, educational opportunity, economic security, and our public revenue system – in the face of the ongoing COVID pandemic. That includes:
- Taxing concentrated wealth to generate ample public revenue
- Increasing public investments to raise compensation for child care workers and providers
- Making health care costs more transparent, and expanding health care access for immigrants, low-income workers, and other marginalized groups
- Enhancing Paid Family & Medical Leave to make access more equitable
Click here to find your representatives in Washington, D.C. and Olympia. Let them know you support these measures, and encourage them to do everything in your power to enact these and other public policies that will build an economy that works – for everyone.
Previous: Part 4 – Wealth Inequality
[i] Source: U.S. Bureau of Labor Statistics, https://fred.stlouisfed.org/graph/?graph_id=965755
More To Read
State of Working Washington
August 10, 2021
New State Programs May Ease a Short-Term Evictions Crisis, but Steep Rent Hikes Spell Trouble
State and local lawmakers must fashion new policies to reshape our housing market
State of Working Washington
November 20, 2020
We Can Invest in Us
Progressive Revenue to Advance Racial Equity