 Imagine boarding a crowded escalator in a department store. Standing at the bottom, you look at the long line of people ahead of you also going up, and think, “Well, we’re all getting there eventually”.
But what if you had a friend shopping with you who happens to be a wizard? With a deft flick of the wrist, the people ahead of you would move to one side, leaving a clear path for the two of you to climb past your fellow shoppers on the moving stairs.
That’s the difference between absolute mobility – when everyone is moving together, but their positions on the escalator are unchanged – and relative mobility, when your own position improves compared to everyone else. Mentally swap out the escalator for income, and you’ve got a pretty good metaphor for understanding economic mobility.
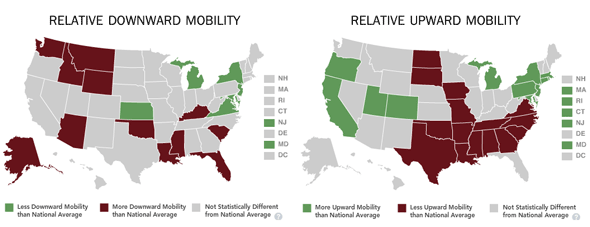
Just don’t forget that escalators, like income, sometimes go down too. Case in point: Washington state, where according to the Pew Center on the States, relative downward mobility is higher than average. 32% of Washington residents started in the top half of the national earnings distribution, but moved down 10 or more percentiles over a 10-year period.
On the somewhat brighter side, relative upward mobility in Washington is about the same as the rest of the country. But our neighbors to the south outshine us: 40% of Oregon residents, and 39% of California residents, experienced upward mobility – starting in the bottom half, and moving up 10 or more percentiles over a 10-year period.
Then there’s Oklahoma, Louisiana, Mississippi, and North Carolina, which are both less upwardly mobile and more downwardly mobile than the rest of the nation. And at the other end of the spectrum: Michigan, New York, Maryland and New Jersey, which are more upwardly mobile and less downwardly mobile.

Click to see how your state’s absolute and relative economic mobility measures up. (Image: Pew Center on the States)
But that’s all about relative mobility. Which states have the outright highest average growth in earnings (i.e. the best absolute mobility – or the fastest moving escalators, so to speak)? That honor goes to Maryland, New Jersey and New York, better on all 3 measures used by Pew; and Connecticut, Massachusetts, Pennsylvania, Michigan and and Utah, better on 2 of 3 measures.
The states with the lowest absolute mobility are all in the South, and have consistently lower upward and higher downward mobility compared to the national average: Louisiana, Oklahoma, and South Carolina on all 3 measures; Alabama, Florida, Kentucky, Mississippi, North Carolina and Texas on 2 of 3 measures.
Pew’s research finds economic mobility is influenced by a variety of factors including education, neighborhoods, savings, and family structure – as well as income, race, and gender. There’s something interesting about that list of factors: Many of them are strongly influenced, for better or worse, by public policy.
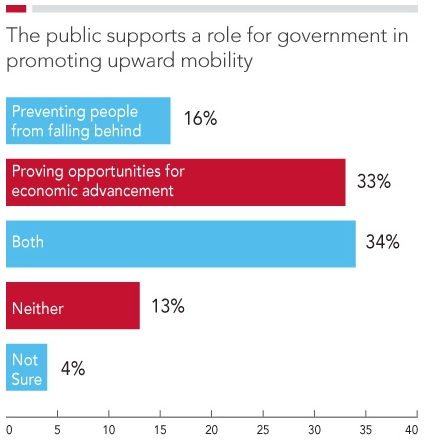
That fact is not lost on the American people. The American Dream is built on the idea that people can move up (or down) the economic ladder within a lifetime or from one generation to the next – and they’d like their elected leaders to do something about it.
The top five goals Americans want their government to work toward, to promote opportunity, according to Pew:
- Ensuring all children get a quality education (88 percent)
- Promoting job creation (83 percent)
- Ensuring equal opportunity (79 percent)
- Letting people keep more of their money (78 percent)
- Providing basic needs to the very poor (75 percent)
Read more about American economic mobility from the Pew Center on the States.
More To Read
September 24, 2024
Oregon and Washington: Different Tax Codes and Very Different Ballot Fights about Taxes this November
Structural differences in Oregon and Washington’s tax codes create the backdrop for very different conversations about taxes and fairness this fall
September 10, 2024
Big Corporations Merge. Patients Pay The Bill
An old story with predictable results.
September 6, 2024
Tax Loopholes for Big Tech Are Costing Washington Families
Subsidies for big corporations in our tax code come at a cost for college students and their families

