With state legislators still at an impasse over Washington’s budget, we’re unveiling a new interactive research tool that allows citizens, journalists, and students to easily examine how public dollars are being spent, and assess the impact of this year’s budget proposals on public schools and universities, hospitals, prisons, courts, health care, and other critical state services.
Visit the State of Working Washington to compare expenditures on budget items as broad as Public Education or as specific as the Department of Fish and Wildlife. For example: since 2009, state parks have lost 83% of their funding. Higher education now accounts for just 8.38% of the state budget – a loss of more than $650 million since 2002:
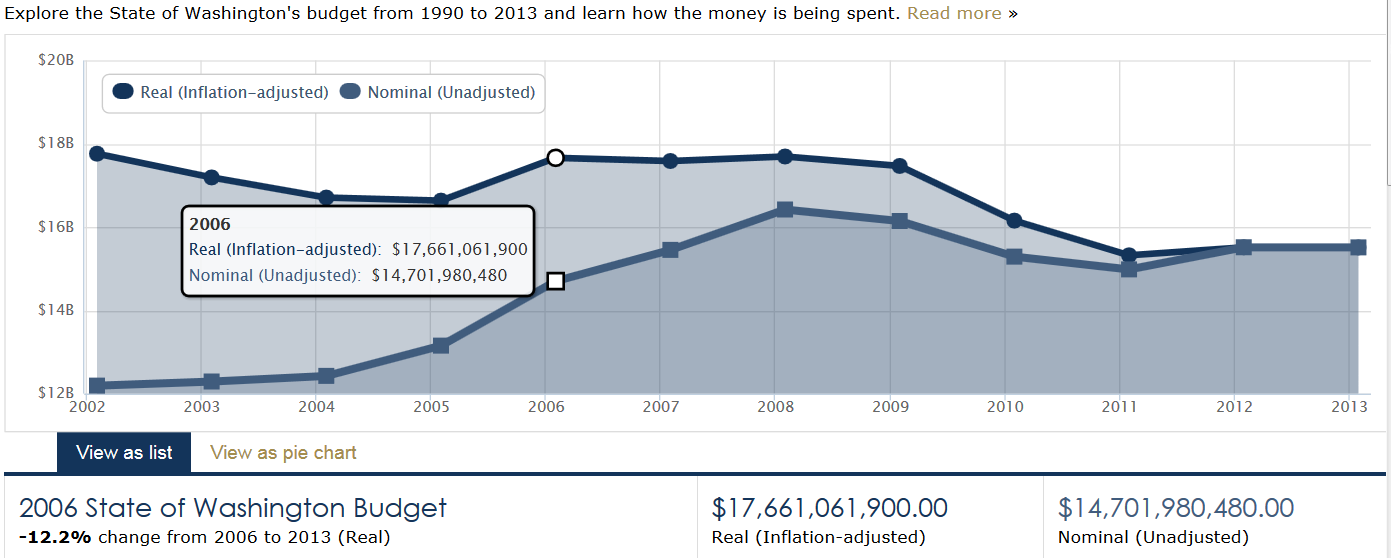
Screenshot from the State of Working Washington
All charts and tables display both “real” (inflation-adjusted) budget numbers calculated by the Economic Opportunity Institute, alongside “nominal” (unadjusted) numbers provided by the Washington State Office of Fiscal Management.
More screenshots and examples from http://stateofworkingwa.org/budget:
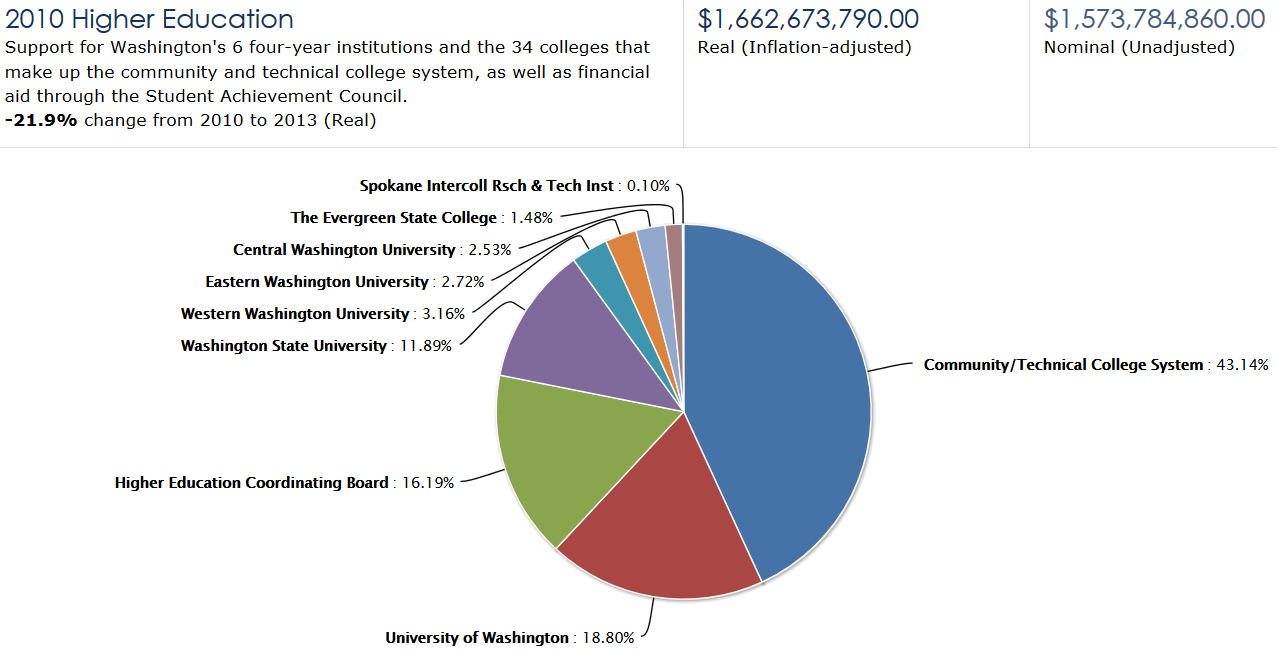
A pie chart showing distribution of funds to Higher Education in 2010
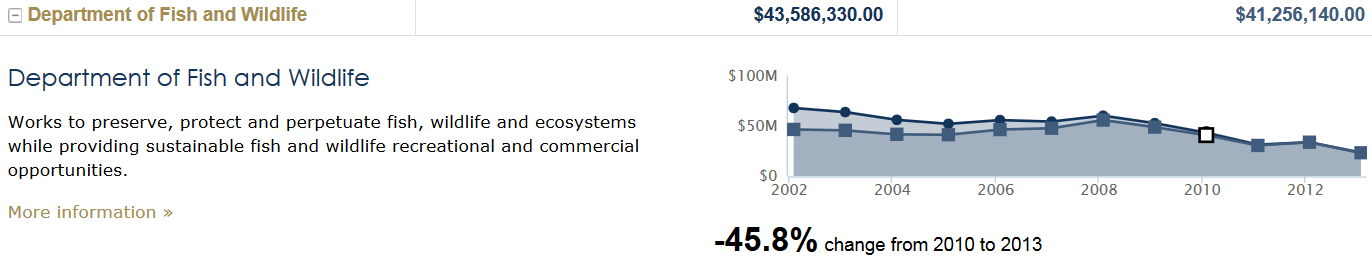
A line chart showing Department of Fish and Wildlife expenditures from 2002 – 2013
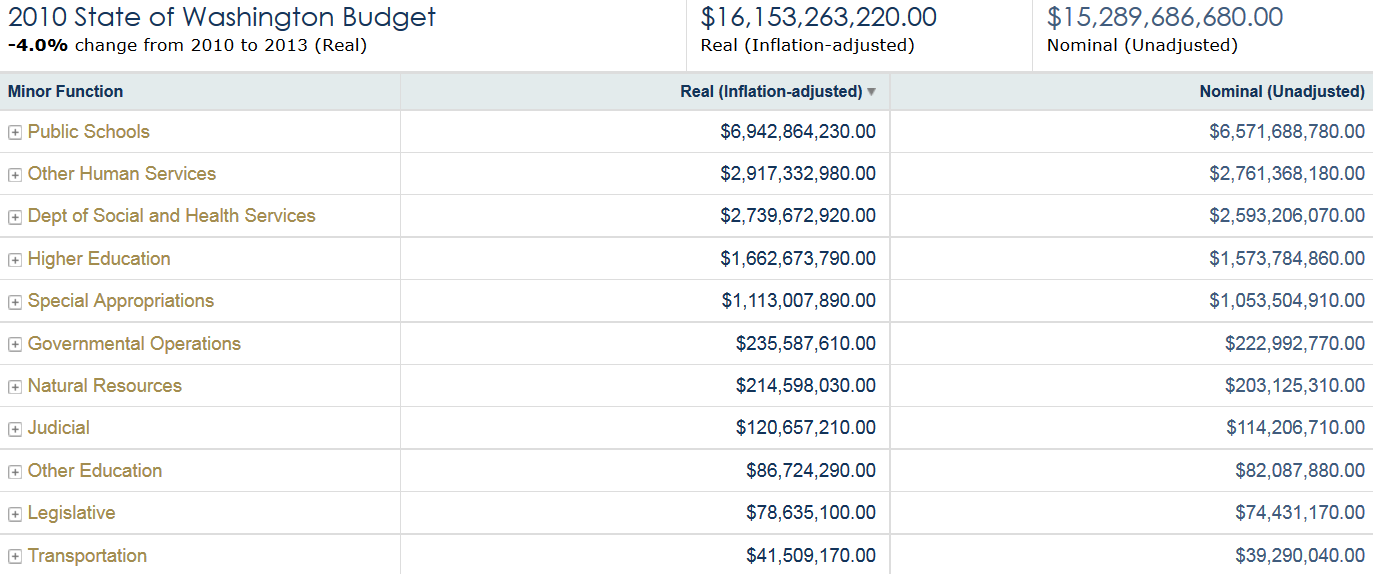
An itemized list of major spending areas in the 2010 state budget
More To Read
September 24, 2024
Oregon and Washington: Different Tax Codes and Very Different Ballot Fights about Taxes this November
Structural differences in Oregon and Washington’s tax codes create the backdrop for very different conversations about taxes and fairness this fall
September 10, 2024
Big Corporations Merge. Patients Pay The Bill
An old story with predictable results.
September 6, 2024
Tax Loopholes for Big Tech Are Costing Washington Families
Subsidies for big corporations in our tax code come at a cost for college students and their families