The current economic expansion, now the longest in post-war history, certainly looks rosy on the surface: since 2008, Washington has added nearly 479,000 nonfarm jobs, and average hourly wages have climbed 22.6 percent after adjusting for inflation.[1]
But while more people have jobs compared to a decade ago, wage gains have largely accrued to a relatively small group of people working in a select few economic sectors. For everyone else, wage growth has been sluggish – at best. That doesn’t bode well for the next (inevitable) economic downturn.
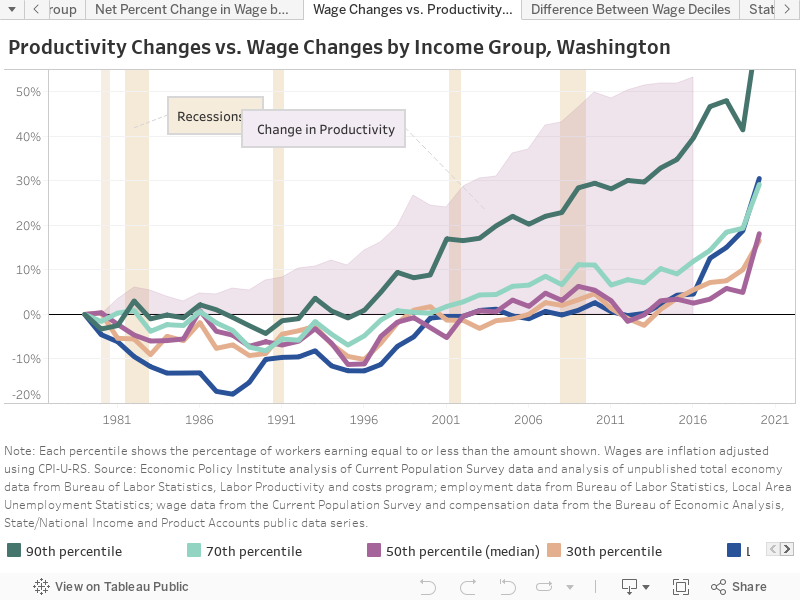
Let’s put the current economic expansion into context. Despite the long boom, most Washington workers haven’t made real economic gains in decades. Since 1979, hourly wages for the bottom 60 percent of workers have increased $1/hour or less (about 4.3 percent), despite the fact that overall economic productivity climbed 53 percent.[2] Nearly all of the economic gains of the past 40 years have gone to the top 30 percent of workers.

In most of Washington’s biggest employment sectors, wage gains since the Great Recession have been meager.[3] In the state’s nine largest sectors – which comprise 73 percent of all nonfarm employment and have contributed nearly 7 in 10 new jobs since 2008 – average wages have increased just $978, or 1.9 percent, annually. But that actually overstates the wage gains being made by most workers.
Above-average wages in Nonstore retail (think Amazon) account for just 1.5 percent of the state’s total jobs in 2018, but 25 percent of that overall wage increase. Excluding Nonstore retail, average wages have increased just $726 (1.4 percent) annually since 2008. Meanwhile, in the state’s manufacturing sector, outside of aerospace (where wages are above average but employment growth is basically flat), wages are below average, and there are 3450 fewer jobs than at the start of the Great Recession.


Job and Wage Growth: High Employment Sectors
| Sector | Total Jobs 2019 Q4 (% of total) | New Jobs 2008 Q1-2019 Q4 (% of total) | Avg. Wage 2019 Q2 (vs. WA avg.) | Avg. Annual Wage Increase 2008 Q1-2019 Q2 (%) |
| Health Care and Social Assistance | 439,217 (12.6%) |
92,525 (19.3%) |
$53,823 (-$29,234) |
$413 (0.8%) |
| Retail Trade | 389,958 (11.2%) |
62,592 (13.1%) |
$62,064 (-$20,993) |
$2,475 (7.1%) |
| Retail Trade (less Nonstore retailers)* |
337,128 (9.7%) |
21,635 (4.5%) |
$40,305 (-$42,753) |
$680 (2.1%) |
| Nonstore retailers* | 52,831 (1.5%) |
40,957 (8.6%) |
$206,195 (+$123,138) |
$10,718 (12.1%) |
| Local Government | 361,833 (10.4%) |
38,200 (8.0%) |
$61,529 (-$21,529) |
$709 (1.3%) |
| Accommodation and Food Services | 293,442 (8.5%) |
57,500 (12.0%) |
$24,469 (-$58,589) |
$447 (2.3%) |
| Manufacturing | 293,408 (8.4%) |
1942 (-0.8%) |
$85,212 (+$2,155) |
$1,112 (1.5%) |
| Manufacturing (less aerospace) |
205,025 (5.9%) |
-3,450 (-0.7%) |
$65,585 (-$17,473) |
$457 (0.8%) |
| Aerospace | 88,383 (2.5%) |
5392 (1.1%) |
$132,416 (+$49,359) |
$2,578 (2.5%) |
| Professional, Scientific, and Technical Services | 218,408 (6.3%) |
51,508 (10.8%) |
$101,354 (+$18,296) |
$1,625 (1.9%) |
| Construction | 219,725 (6.3%) |
19,267 (4.0%) |
$65,516 (-$17,542) |
$600 (1.0%) |
| Administrative and Support Services | 158,475 (4.6%) |
25,708 (5.4%) |
$50,887 (-$32,170) |
$919 (2.3%) |
| State Government | 149,750 (4.4%) |
-2,942 -(0.6%) |
$67,197 (-$15,861) |
$708 (1.2%) |
| Total/Average | 2,524,217 (73%) |
346,300 (72%) |
$62,176 (-$20,881) |
$978 (1.9%) |
Sources: 1) Employment Estimates (WA-QB, not seasonally adjusted) through December 2019 (preliminary), and 2) Covered Employment (QCEW) through June 2019 (preliminary), shown as annualized four-quarter rolling averages, with wages expressed in 2019 dollars using CPI-U-RS (estimated). *2018-19 Retail Trade (less Nonstore retailers) and Nonstore retailers wage data is estimated based on overall sector trends.
Meanwhile, a handful of high-wage job categories have been reaping most of the gains of a growing economy.[4] Four sectors (Professional, Scientific, and Technical Services; Information; Finance and Insurance; and Management of Companies and Enterprises) — which together comprise just 15 percent of nonfarm employment — have seen annual wage increases averaging $3,634 (3.8 percent) since 2008. Wage increases in Software Publishing, which accounts for just under half of all Information sector jobs, are particularly outsized, averaging $9,133 (5.3 percent) per year.


Job and Wage Growth: High Wage Sectors
| Sector | Total Jobs 2019 Q4 (% of total) |
New Jobs 2008 Q1-2019 Q4 (% of total) | Avg. Wage 2018 Q2 (vs. WA avg.) | Avg. Annual Wage Increase 2008 Q1-2019 Q2 (%) |
| Professional, Scientific, and Technical Services | 218,408 (6.3%) |
51,508 (10.8%) |
$101,354 (+$18,296) |
$1,625 (1.9%) |
| Information | 144,750 (4.2%) |
39,033 (8.2%) |
$216,390 (+$133,333) |
$8,433 (6.8%) |
| Information (less Software publishers) |
74,583 (2.1%) |
19,808 (4.1%) |
$162,140 (+$79,083) |
$7,631 (9.8%) |
| Software publishers | 70,167 (2.0%) |
19,225 (4.0%) |
$272,052 (+$188,995) |
$9,133 (5.3%) |
| Finance and Insurance | 100,083 (2.9%) |
283 (0.1%) |
$102,636 (+$19,579) |
$1,472 (1.7%) |
| Management of Companies & Enterprises | 44,575 (1.3%) |
9,858 (2.4%) |
$123,702 (+$40,645) |
$1,784 (1.7%) |
| Total/Average | 493,250 (14%) |
91,183 (20%) |
$125,442 (+$44,828) |
$2,722 (2.8%) |
Sources: 1) Employment Estimates (WA-QB, not seasonally adjusted) through December 2019 (preliminary), and 2) Covered Employment (QCEW) through June 2019 (preliminary), shown as annualized four-quarter rolling averages, with wages expressed in 2019 dollars using CPI-U-RS (estimated). 2018-19 Retail Trade (less Nonstore retailers) and Nonstore retailers wage data is estimated based on overall sector trend.
Sluggish wage growth and massive economic inequality aren’t the only economic headwinds facing Washington’s working families. Even after adjusting for inflation, costs are going up for critical needs like rent (or home ownership), health care, child care, and higher education. And to top it off, Washington’s low- and middle-income households pay a far higher share of their income in taxes than do those with higher incomes.
These trends aren’t just making everyday life a struggle for people – they’re making it impossible for many Washington households to build even a modest measure of economic security.
It doesn’t have to be this way. During the 2020 legislative session now underway, state and local leaders have the chance to make reforms that a) make Washington’s tax system more equitable, and b) promote increased investment in public policies that build and protect economic security for our families and communities. That includes: ramping up construction of affordable housing, tamping down out-of-pocket costs for health care, lowering the cost of child care by increasing subsidies for providers, teachers and families, and reducing tuition for public higher education, to name just a few!
Otherwise, when the next recession comes — as it inevitably will — it’s going to hit harder and hurt more than it needs to.
[1] Based on EOI analysis of Washington State Employment Security Department data: 1) Employment Estimates (WA-QB, not seasonally adjusted) through December 2019 (preliminary), and 2) Covered Employment (QCEW) through June 2019 (preliminary), shown as annualized four-quarter rolling averages, with wages expressed in 2019 dollars using CPI-U-RS (estimated).
[2] “Wages” include only hourly or salaried remuneration to employees.
[3] Wage and job figures for high-employment sectors based on EOI analysis of Washington State Employment Security Department data: 1) Employment Estimates (WA-QB, not seasonally adjusted) through December 2019 (preliminary), and 2) Covered Employment (QCEW) through June 2019 (preliminary), shown as annualized four-quarter rolling averages, with wages expressed in 2019 dollars using CPI-U-RS (estimated).
[4] Wage and job figures for high-employment sectors based on EOI analysis of Washington State Employment Security Department data: 1) Employment Estimates (WA-QB, not seasonally adjusted) through December 2019 (preliminary), and 2) Covered Employment (QCEW) through June 2019 (preliminary), shown as annualized four-quarter rolling averages, with wages expressed in 2019 dollars using CPI-U-RS (estimated).
More To Read
A Fair Deal at Work
February 27, 2024
Which Washington Member of Congress is Going After Social Security?
A new proposal has Social Security and Medicare in the crosshairs. Here’s what you can do.
A Fair Deal at Work
February 27, 2024
Hey Congress: “Scrap the Cap” to Strengthen Social Security for Future Generations
It's time for everyone to pay the same Social Security tax rate – on all of their income
A Fair Deal at Work
February 7, 2024
Washington Future Fund Gains Grassroots Momentum
The Washington Future Fund, also known as baby bonds, is getting noticed.
Maralyn Chase
Each year Washington high schools graduate about 80,000 — some of whom will go to college or directly enter the workforce if they can find a job. In the last 10 years (2008 to 2018) we have created ~ 440,000 new jobs — 4400 new jobs each year.
The Bureau of Labor Statistics reported that only about 62% of the eligible civilians participated in the labor force. Somewhere we have almost 40% of the people who should/could be working are not actually working. And, of course as you know, they are not counted as being unemployed. They simply do not exist when we talk about the numbers in our workforce. They do exist, I believe, when we count the homeless and discouraged. We need to start talking about them as part of the unemployed civilian labor force. Thanks for all your work!
May 6 2019 at 6:11 PM
Aaron Keating
Good point, Maralyn. The official measure of unemployment excludes people who would actually like to have a job, but who haven’t been looking for one reason or another — as well as those would work more hours, but aren’t getting them. And while a statewide measure of unemployment is a useful barometer, it doesn’t show how widely the employment picture varies locally. I take a closer look those and other aspects of (un)employment here: https://www.opportunityinstitute.org/blog/post/the-unemployment-rate-isnt-all-that-matters/. Thanks for your comment!
May 13 2019 at 9:44 AM