CFED’s 2016 Assets and Opportunity Scorecard is out – and many of its measures indicate that while Washington (like much of the country) appears to be rebounding from the Great Recession, a great many families are still struggling –and families of color face higher barriers to financial security. Here’s how The Evergreen State stacks up:
Financial Assets and Income | Grade A | Rank 10
High marks. Washington ranks in the top five in terms of liquid asset poverty rate: two out of three Washington households have sufficient liquid assets to survive at the poverty rate for three months without income. Washington also ranks in the top five for the number of households with savings accounts, with more than four in five households using a savings account.
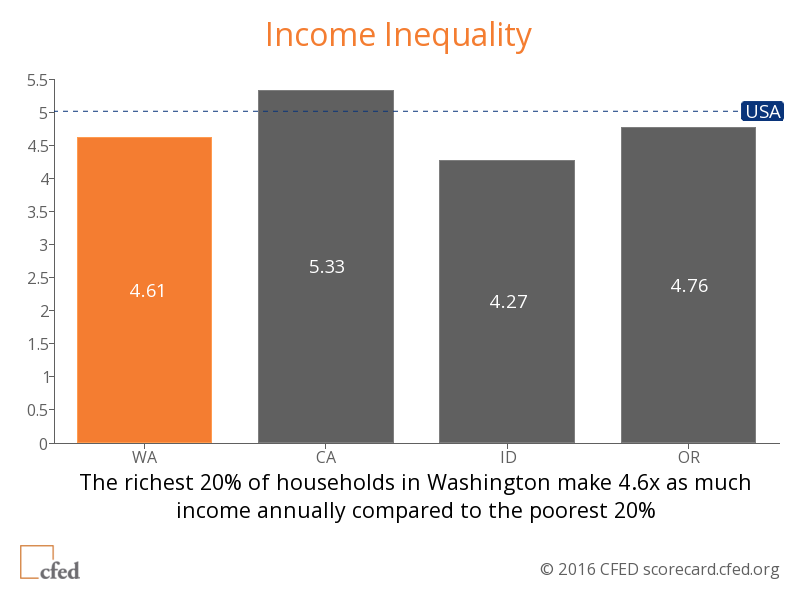
Low marks. The state ranks 21st in income inequality: the richest 20% have annual incomes that are 4.6 times higher than the poorest 20%.
Businesses and Jobs | Grade B | Rank 12
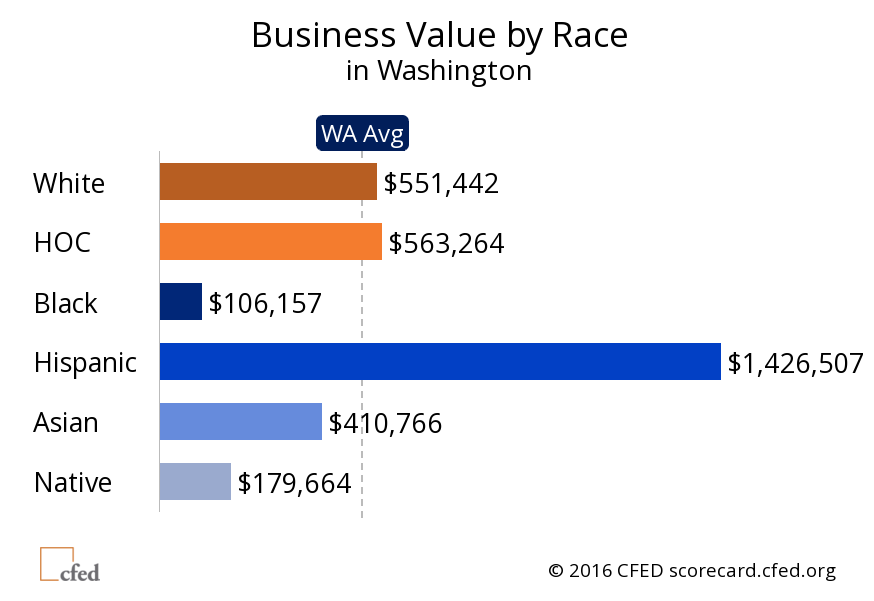
High marks. Washington ranks 2nd in the country in terms of the effects of race and ethnicity on business value.[1] In the U.S., businesses owned by whites generally have much higher annual receipts than businesses owned by people of color – to the tune of 2.9 times as high. In Washington, business receipts are similar between owners of color and white owners, and in fact, businesses owned by people of color have annual receipts slightly higher than businesses owned whites.
Low marks. Although the value of businesses owned by workers of color is similar to that of those owned by white workers, business owners are still more likely to be white. Business ownership in Washington is 1.6 times as high for white workers than workers of color, placing Washington 34th out of all states. In addition, although the average business values of business owners of color and white business owners are similar, the disaggregated data show a different story. Latino business owners have much more valuable businesses than the rest of the state, and Black, Asian and Native American business owners have markedly less valuable businesses.
Washington beats most of the country in the percentage of low-wage jobs, ranking fifth in the country. Yet 17.3% of Washington jobs are in occupations with median annual pay below federal poverty for a family of four – or about $23,600 – and this number has increased drastically since before the Recession, when only 11.8% of jobs were in low-wage occupations.
Washington ranks 34th in underemployment rate, with 11.4% of the civilian workforce described as unemployed, marginally attached workers, or workers employed part-time for economic reasons. The national average is 10.8%.
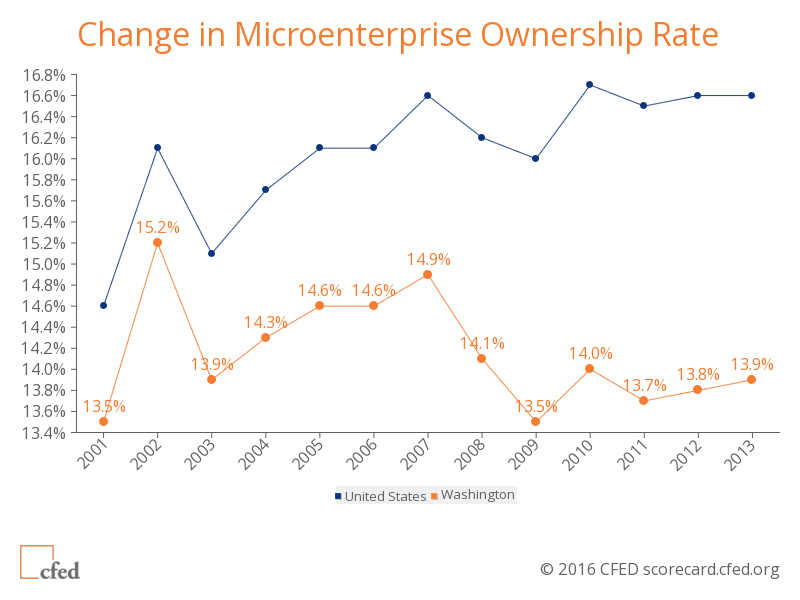
Finally, Washington ranks 47th in the number of microenterprises (firms with less than five employees). These microenterprises represent a significant source of opportunity, especially for low-income individuals, but Washington’s microenterprise ownership rate is just 13.9%, less than the national average of 16.6%. Although Washington saw improvements on this measure in the early 2000s, it has yet to reach pre-Recession rates.
Housing and Homeownership | Grade C | Rank 34
High marks. Washington does not rank higher than 14th in any category of this issue area. It barely beats the national average in homeownership by gender (single women are 1.06 times more likely than single men to own a home, versus 1.03 times nationwide); foreclosure rate; percentage of delinquent mortgage loans and high-cost mortgage loans; and housing cost burden for renters.[2]
Low marks. Washington ranks better than the national average in homeownership by race – albeit not by much – but this can hardly be called a high mark. Across the nation, white households are 1.6 times more likely to own a home than households of color; in Washington, they are only 1.5 times more likely.
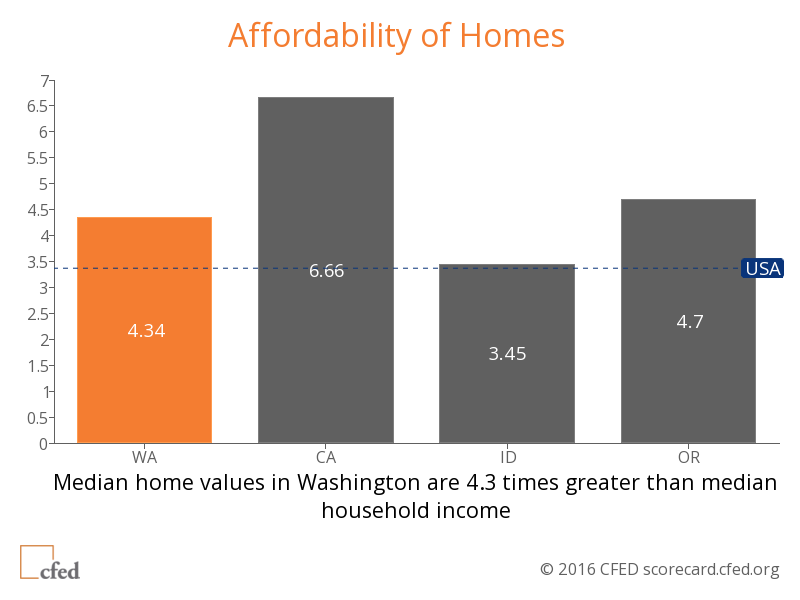
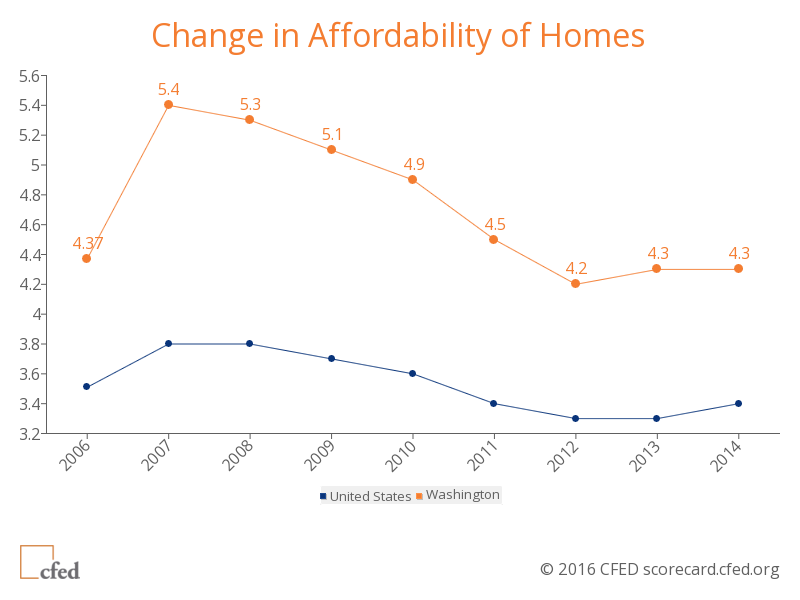
While Washington is slightly better than the national average in terms of housing cost burdens for renters, it is slightly worse than the national average in terms of housing cost burdens for homeowners. For renters, half of Washington renting households spend more than 30% of their income on rent and utilities. For homeowners, 31.7% spend 30% or more on monthly owner costs. Washington ranks 44th in affordability of homes: the median housing value is 4.3 times the median family income, versus 3.4 times higher across the U.S.
Health Care | Grade B | Rank 18
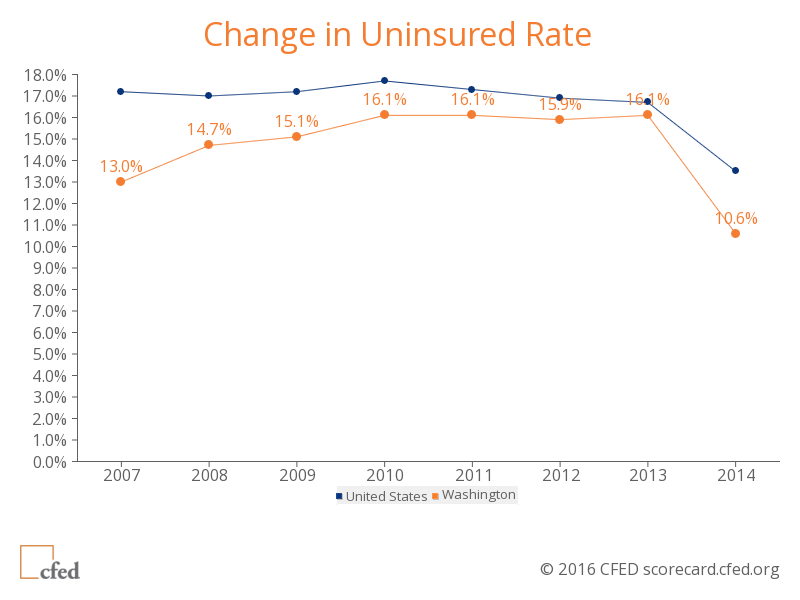
High marks. Washington beats the national average in every category except gender disparities in the uninsured rate, even though it does not rank particularly high on any one category. Washington’s overall uninsured rate is 10.6%, lower than the national average of 13.5%. The uninsured rate for low-income children is 6.3%, compared to the national average of 8.2%.
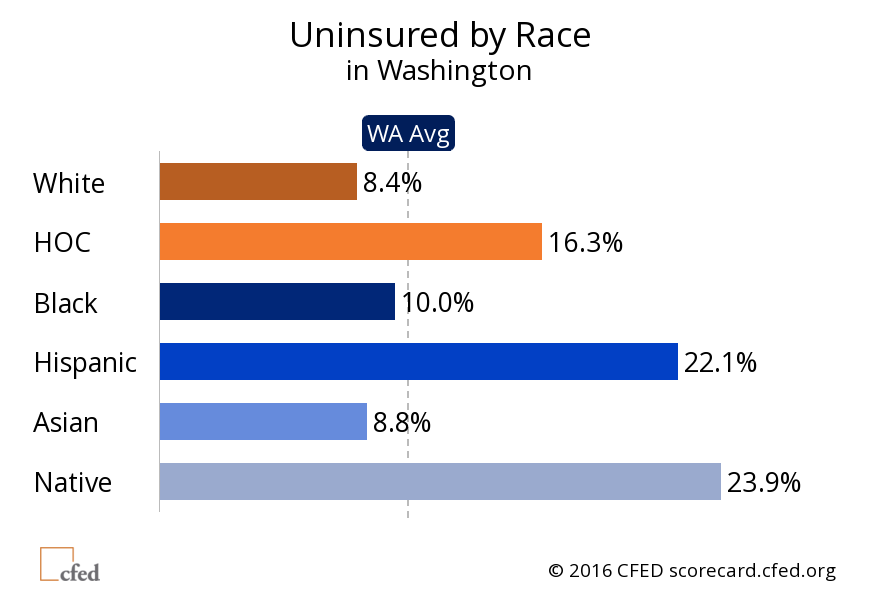
Low marks. Although Washington beats the national average in terms of racial and income disparities in uninsured rates, the disparities are still inexcusably high. People of color are 1.9 times more likely to be uninsured than white people, and the poorest 20% are 3.8 times more likely to be uninsured compared to the richest 20%. The uninsured rate among Native Americans and Latinos is about double the statewide average.
Education | Grade A | Rank 9
High marks. Washington ranks in the top 10 in 4 of 14 categories: 8th-grade math proficiency (39%); 2-year college degree attainment (43.2%); income disparities in 4-year college degree attainment; and average college graduate debt ($24,804).
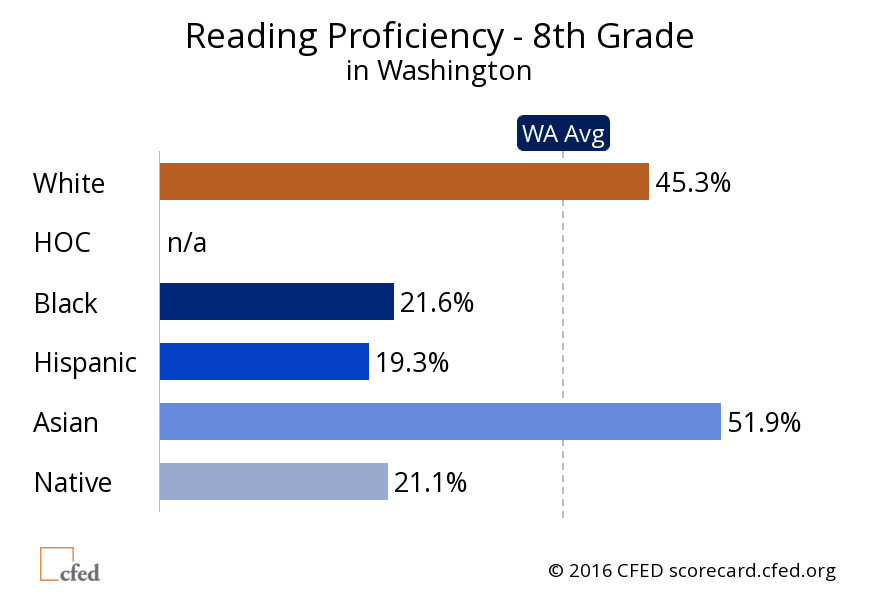
Low marks. Washington ranks 40th in early childhood education enrollment and 38th in the high school graduation rate. Although it beats the national average in 8th-grade reading proficiency, just 37.4% of 8th-graders are proficient, and the rates are much lower for Black, Latino and Native American 8th-graders.
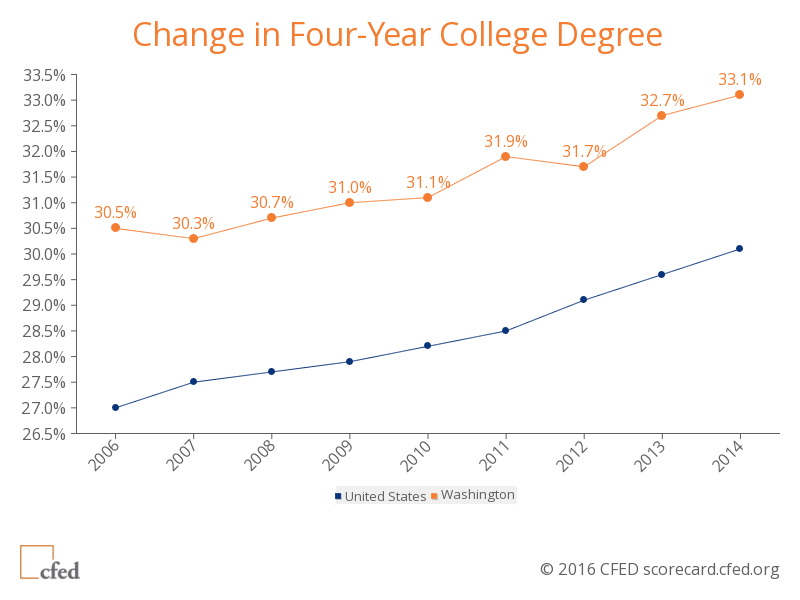
There are significant racial and income disparities across the entire spectrum of educational attainment. White Washingtonians are 1.3 times more likely to hold a four-year degree than Washingtonians of color, and the richest 20% are 3.4 times more likely to hold one than the poorest 20%.
Policy Proposals
CFED proposes 69 policies to increase financial security and opportunity – 34 of which have been in adopted in Washington, which ranks us 7th among all states. Get the full list of policy proposals and a complete data set on the Assets and Opportunity Scorecard website.
[1] Ratio of the average business value, in terms of sales, receipts or revenue, of white, non-Hispanic-owned businesses to businesses owned by workers of color.
[2] Percentage of renter-occupied units spending 30% or more of household income on rent and utilities.
More To Read
May 19, 2025
A year of reflections, a path forward
Read EOI Executive Director's 2025 Changemaker Dinner speech
March 24, 2025
Remembering former Washington State House Speaker Frank Chopp
Rep. Chopp was Washington state’s longest-serving Speaker of the House
February 11, 2025
The rising cost of health care is unsustainable and out of control
We have solutions that put people over profits

