Click to visit EOI’s State of Washington Budget visualization
Need to fact-check someone during a Facebook debate, or just prep for an intense upcoming round of pub trivia? EOI has you covered.
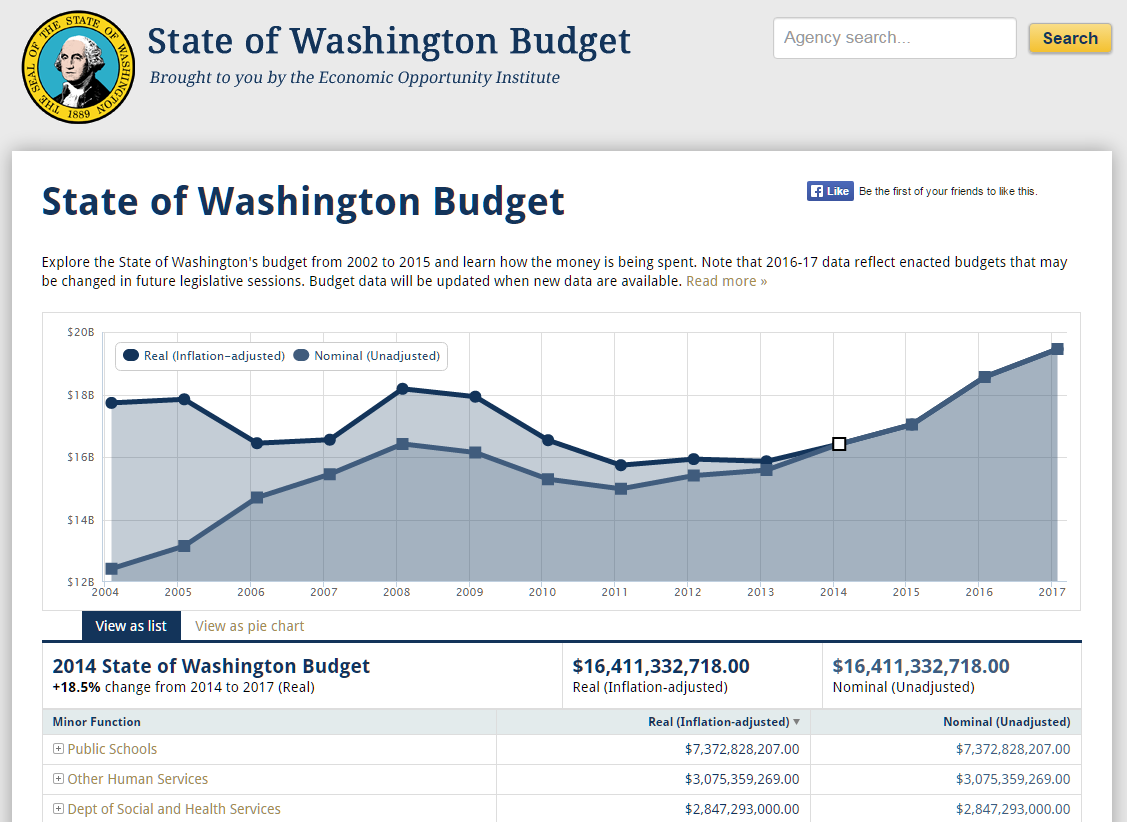
EOI’s State of Washington Budget visualization let’s you see budget trends as far back as 2004 and as far ahead as 2017, on a scale as broad as the state’s overall budget or as specific as an individual department within an agency.
All charts and tables display both “real” (inflation-adjusted) budget numbers calculated by the Economic Opportunity Institute, alongside “nominal” (non-inflation adjusted) numbers provided by the Washington State Office of Fiscal Management.
Enjoy!
More To Read
May 19, 2025
A year of reflections, a path forward
Read EOI Executive Director's 2025 Changemaker Dinner speech
March 24, 2025
Remembering former Washington State House Speaker Frank Chopp
Rep. Chopp was Washington state’s longest-serving Speaker of the House
February 11, 2025
The rising cost of health care is unsustainable and out of control
We have solutions that put people over profits