To read in PDF, click here .
Washington is one of the country’s most affluent states, ranking fourth in GDP per capita and seventh in median household income.[1] However, Washington’s tax system prevents the state from turning its affluence into true prosperity. Through good times and bad, Washington has continued to underfund K-12 education, higher education, child care, public health, and behavioral health care, and is seemingly powerless to remedy persistent and growing housing insecurity. At the same time, Washington’s economy perpetuates racial inequality and accelerates economic inequality. A key reason for Washington’s failure to achieve economic prosperity is the state’s unfair tax system. Year after year, Washington’s outdated tax structure puts the state at the bottom of the fifty states, in terms of tax equity, and at the top, in terms of a tax system favorable to the ultra-rich. A more equitable tax system would include Washington’s most affluent residents in building prosperity for all.
Affluence Without Prosperity
By some measures, Washington is an affluent state. Its GDP per capita of $80,500 ranks fourth among the 50 states and its median household income of $78,700 ranks seventh. Washington is home to eleven companies on the 2020 Fortune 500 list, among them Amazon, Costco Wholesale, Microsoft, Starbucks, and Paccar.[2] Amazon’s Jeffrey Bezos sits at number one on the Fortune 400 list of the 400 Wealthiest Americans, with Microsoft’s Bill Gates and Steve Ballmer making the top 10, and Mackenzie Scott the top 20.[3]
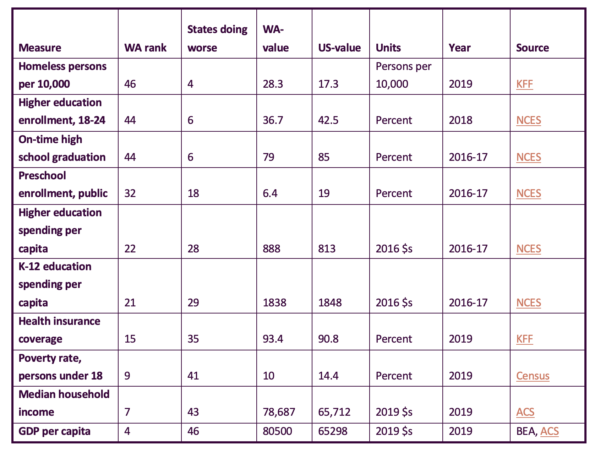
Figure 1.
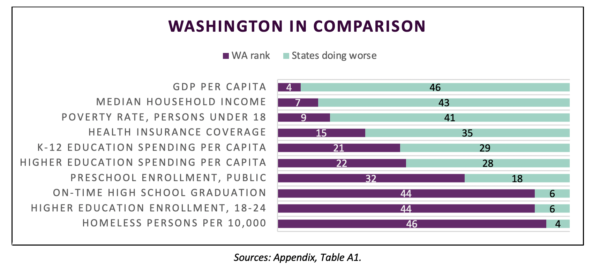
However, by measures of shared quality of life, Washington ranks significantly lower (see Figure 1). Washington ranks only 21st among the 50 states in per capita spending on K-12 education, and in in dollars, spends less than the national average. Only 79 percent of Washington’s high school students graduate on-time, compared to a national rate of 85 percent, placing Washington 44th among the 50 states on this measure. Washington ranks 44th of the 50 states in the share of its 18-24-year-olds enrolled in higher education.
Washington also falls in the bottom half of the 50 states in its investment in preschool education. Investments in early childhood education have high rates of return, and early childhood education is especially important for the long-term thriving of disadvantaged children.[4] A robust preschool education system plays a significant role in advancing gender equity, encouraging women’s participation in the work force.[5] Washington state, however, funds preschool education for only 6.4 percent of 3 and 4-year-olds, compared to a national average of 19.0 percent.[6]
A grim statistic in which Washington comes in near-last is that of homelessness. Washington ranks 46th of the 50 states in terms of the share of its population experiencing homelessness. An estimated 28 of every 10,000 Washington residents is without a home, compared to a national level of 17 persons per 10,000.[7]
Addressing these issues requires constructive and creative solution-building, including a more progressive and productive tax structure to provide sustained resources to build shared prosperity.
Washington’s Taxes Over Time
Over time, Washington’s state tax system has not kept up with economic growth and change. The state’s antiquated reliance on sales, excise, and business taxes has left Washington vulnerable to a shrinking and unstable tax base.
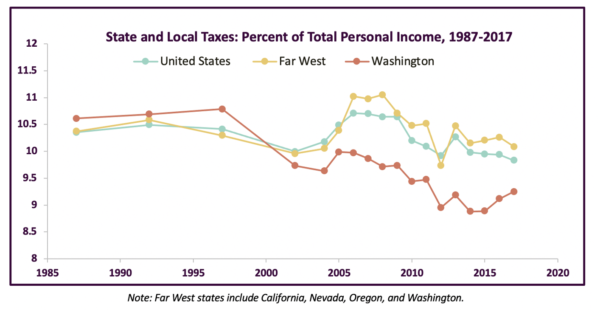
Compared to other states, Washington’s tax system does a poor job of generating revenue for public services. Washington ranks just 31st among the 50 states in the percentage of the total income of the state’s population going to state and local taxes. In 2017, Washington’s state and local taxes came to 9.3% of total personal income, below the national level of 9.8% (see Figure 2).[8] In 2017, if Washington’s taxes had been at the U.S. rate of 9.8 percent of total income, the state would have raised an additional $2.5 billion. If taxes had been at the average rate of the Far West states, 10.1 percent, the state would have raised an additional $3.6 billion.[9]
Washington’s tax system was not always so out of step. As Figure 2 shows, in the 1980s and 1990s, Washington’s taxes were on par with the other 49 states and with other states in the Far West. In the 1990s, Washington’s tax revenue ranged from 10.4 to 11.4 percent of total personal income. However, beginning in the 2000s, Washington diverged from the rest of the United States and from the West due to its over-reliance on the sales tax and to a wave of anti-tax ballot initiatives. If Washington does not change its tax system, it is projected that Washington’s tax revenue will fall further, to 8.5 percent of personal income by 2025.[10]
Figure 2.
Washington’s Taxes Compared to Other States
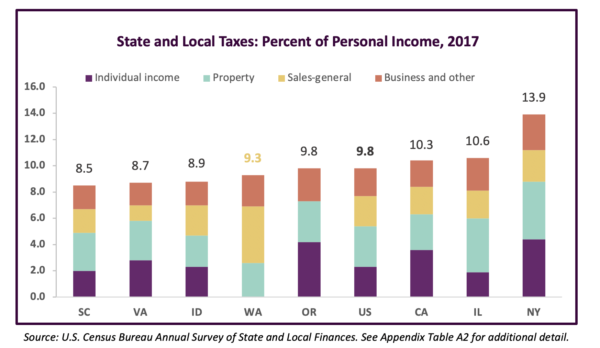
Figure 3 compares Washington’s tax system to those of its Western neighbors Oregon, Idaho, and California, as well as four more distant states with economic ties to Washington. Illinois is included because Boeing chose to relocate its headquarters to Chicago, Illinois, in 2001. New York and Virginia were chosen in 2018 by Amazon as sites for two new headquarters, one in Long Island City, Queens, and the other in Arlington, Virginia.[11] South Carolina makes the list because of its ties to Boeing, which currently produces its 787 Dreamliner solely in North Charleston, South Carolina.[12]
Figure 3.
Individual Income Taxes
Washington, along with only seven other states, does not impose taxes on any form of household income.[13] Forty-two states tax overall household income, and of these, 32 states have progressive income tax rates. In the 32 states with progressive tax rates, the top marginal rates range from 2.9 percent in North Dakota to 12.3 percent in California. The other ten states impose flat rates ranging from 3.07 percent in Pennsylvania to 5.25 percent in North Carolina. New Hampshire taxes only dividend and interest income, at a flat rate of 5 percent on dividends and interest that exceed $2400 (single filers) or $4800 (joint filers).[14]
Most states use adjusted gross income from federal income tax forms as the starting point for state taxes, but many make adjustments to the federal definition of income, excluding or applying different rates to income from particular sources.[15] Of the 42 states with overall income taxes, 28 have some form of Earned Income Tax Credit (EITC) at the state level. The EITC is an anti-poverty program that provides a tax credit to low- to moderate-income working individuals and families.[16]
Property taxes
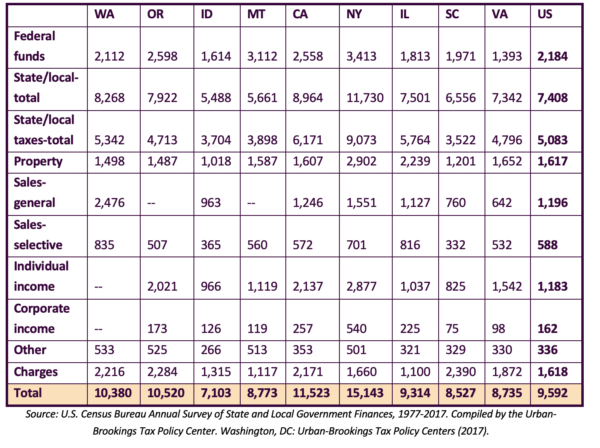
Washington, like 37 other states, raises state and local revenue via property taxes. At the state level, property taxes are Washington’s third-largest source of revenue, behind sales and business taxes, accounting for about 13 percent of state tax revenue in 2020.[17] Of the states compared here, all have property taxes, although in Idaho and New York, all property taxes raised go only to local governments, such as school districts and cities. Property tax rates are generally set to raise a specific level of income for the state or locality. The rates, therefore, vary over time depending on the revenue target and the valuation of the tax base. In 2017, Washington’s per capita property tax revenue of $1,498 fell slightly below the national average of $1,617.[18]
Sales taxes
Washington relies much more heavily on its sales tax than do most other states. General and specific sales tax revenue is the state’s largest source of revenue, bringing in 56 percent of state tax dollars in 2020.[19] Washington’s state tax rate on general sales is 6.5 percent. Counties, cities, and transit districts also collect general sales tax, meaning that the general sales tax rate varies with location (so much so that a car dealership in Burlington, Washington attempts to draw customers by offering “the lowest sales tax rate in Western Washington, at 8.5%).[20] Overall, the combined state and local sales tax rate averages 9.22% statewide. Each Washington resident paid an average of $2,476 in general sales taxes in 2017, more than twice the national average of $1,196.[21] Like many states, Washington exempts some necessities such as food, prescription drugs, and newspapers from taxation.
Business taxes
The Business and Occupation (B&O) tax is Washington’s primary tax on corporations and is the second-largest revenue source for the state’s general fund after the sales tax.[22] In 2020, B&O taxes accounted for 17 percent of the state’s revenue.[23] The B&O tax is levied on the gross receipts of business activities conducted within the state.[24] Unlike a corporate net income tax, there are no deductions for the costs of doing business. Because the B&O tax is levied on gross receipts, not profits, its rates are quite low, ranging from 0.471 percent for retailing to 1.5 percent for services. The B&O tax is complex, incorporating nearly 200 credits, deductions and exemptions.[25]
Other taxes
Like many states, Washington collects revenue through excise taxes on items such as motor fuels, alcoholic beverages, and tobacco products. Washington’s tax system also includes an estate tax.
State Taxes on the Richest and Poorest
In order to determine the impact of Washington’s taxes on households at different income levels, we need to know the sources of income received by those households, as well as other household assets or spending that might be subject to taxation. Beginning with income, Table 1 illustrates the sources of income for households across the U.S. with different levels of income.
Table 1: Income sources of U.S. households at different levels of income, 2017
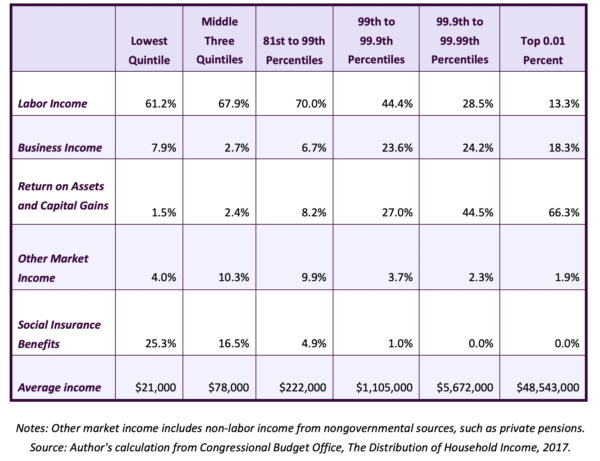
Beginning with the lowest-income households, the Congressional Budget Office estimates the average income of households in the bottom 20 percent of the nation’s income distribution to be $21,000, with more than 60 percent of that income coming from labor earnings. The middle three quintiles, loosely the “middle class,” average $78,000 in income, with about two-thirds of that consisting of labor income.
For most households in the top 20 percent of the national distribution, labor income is also the major source of income. Labor income makes up 70% of the income of households between the 81st and the 99th percentiles of the income distribution.
For households in the top 1 percent of the income distribution, the composition of income shifts substantially away from labor income towards business income, dividends and interest, and capital gains. At the summit of the distribution—the top 0.01 percent—about two-thirds of income comes from asset returns and capital gains, an average of about $32 million per household in 2017. Given the number of billionaires in Washington state and their collective wealth, it is likely that the Washington state distribution is similarly skewed. In Washington, as in the U.S. as a whole, asset returns and capital gains are the dominant source of income for those at the top of the income distribution.[26]
Taxes Paid by Washington Households at Different Levels of Income:
Moving from income to taxes, Washington’s tax system treats taxpayers at different income levels very differently, reserving its highest effective tax rates for those least able to pay. Table 2 presents the estimated effective tax rates for different income groups.
We see that Washington’s lower income residents pay a much larger share of their income in taxes than do more affluent households. Those in the lowest fifth of the distribution are estimated to pay nearly 17.8 percent of their income in taxes. By contrast, most households in the top 20% pay only 6.2 percent of their income in taxes, with households in the top 1% paying only 3.0% overall. Those in the upper 0.1 and 0.01 percent pay even less than 3 percent of their incomes in taxes, assuming that their spending and property tax bills do not increase in proportion to income. Washington’s tax system is clearly regressive: it draws a larger share of income from those least able to pay.
Table 2: Tax rates on Washington households at different levels of income, 2018
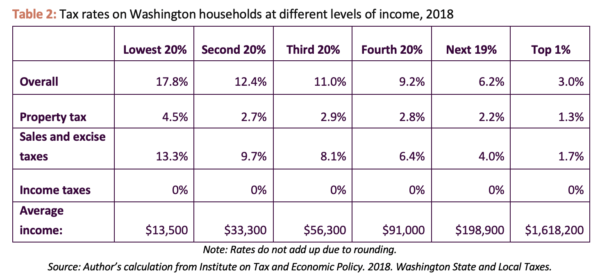
Several factors contribute to the regressivity of Washington’s state tax structure. The first is Washington’s overreliance on sales and excise taxes. A second is the absence of income-based property tax adjustments for the majority of lower income taxpayers. The final factor is a “sin of omission”: regressive taxes on sales and property could be balanced by a state income tax with progressive rates, but Washington does not have one, due in part to court rulings in the 1930s that defined income as property and thus subject to state constitutional restrictions on property taxes.
Washington’s tax system is also very opaque. The state’s reliance on sales and excise taxes means that taxpayers are rarely aware of how much they and others pay in state taxes each year. In 2017, Seattle economist Richard Conway measured the transparency of every state tax system based on U.S. Census data. Oregon, which has an income tax and no sales tax, was the most transparent. Washington’s tax system was found to be nearly the least transparent, ahead only of Nevada.[27]
Taxing the Poor
Comparing tax systems across the 50 states, patterns appear. Southern states diverge profoundly from most the rest of the United States in imposing high tax rates on the poor.[28] This regional distinction is long-standing and is reinforced by such measures as super-majority voting rules and, in the South, on constitutional limits on public sector spending. After the passage of Proposition 13 in California, these measures also spread in the West.
Washington’s tax system resembles the tax systems of the deep South. In Washington’s case, the judicial interpretation prohibiting progressive taxation of income serves to lock the state into a tax system that exacerbates deep income and racial inequality and fails to adapt to a changing economy and evolving needs.
How does Washington tax the poor? Primarily through its over-reliance on the sales tax. The sales tax, because of its single rate structure, does not have uniform impact. Lower-income Washingtonians spend nearly all of their income, making much of their income subject to sales taxation. The chunk of income spent on housing also goes partially to property taxes. Washington’s reliance on sales and property taxes means that Washington’s poor suffer on a persistent basis the loss of disposable income that would otherwise be available to them, a loss that compounds year after year.
All Washington households, but particularly poor households, also suffer from the inadequacy of the sales tax to provide necessary revenue. One driver of the problem is the fact that over time, household spending has shifted from goods to services. Because Washington’s sales tax does not apply to most services, the sales tax base has fallen, relative to income.[29] Washington’s sales tax base fell from 56 percent of total state personal income in 1980 to 36 percent of income in 2016.[30] As Washington has grown richer, sales tax revenue has not kept up.
To make up for the inadequacy of its tax system, Washington “taxes” the poor and working-class households through increased reliance on charges and fees to access public goods. Charges, such as state college and university tuition, license and permit fees, and highway tolls are Washington state’s second largest source of revenue, amounting to $2,216 per capita in 2017, compared to a U.S. average of $1,618.[31] A standard driver’s license in Washington state, for example, costs $54, and an enhanced driver’s license $78.[32] Fees like this impose a disproportionate burden on lower-income households. Fees have increased significantly as tax revenue has failed to keep up with the need for services.
Failing to Include the Rich
Washington also scores an “own goal” against economic prosperity through its failure to appropriately tax its more affluent residents. Washington has stubbornly resisted an income tax. Even as the income gap between low-wage earners and high-income beneficiaries has grown, the state has not used an income tax to appropriately tax those whose affluence results from the economic dynamics of the state.
Reliance on the sales tax leaves the state’s wealthiest residents out of the tax base. Because affluent Washingtonians are able to save a much larger percentage of their income than lower-income and middle-class families, the vast majority of their income is not subject to sales tax. These savings accumulate from year to year. Because interest and other asset returns are not taxed in Washington, the benefits to upper-income Washingtonians are compounded by the returns generated by the year-over-year savings. The design of the tax system means that the poor remain poor, and the rich grow richer.
The state has also fallen behind in appropriate taxation of the unearned income generated by financial and other assets. As Table 3 illustrates, the further one moves up the income ladder, the greater the share of a household’s unearned income: income from returns on financial or other assets. Capital gains are a particularly significant source of unearned income in Washington: in 2016, Washington ranked second among the 50 states in the share of capital gains in the total Adjusted Gross Income (AGI) reported on federal tax returns.[33] In 2018, taken together, unearned income from interest, dividends, and capital gains added up to more than $49 billion dollars, 15 percent of the total AGI reported by Washingtonians.[34] Bringing these resources into the tax base at appropriate rates would provide new resources to build prosperity in Washington. It would move resources from fueling the financialization of the economy into building true prosperity: education, innovation, and infrastructure.[35]
Deepening Inequality
Washington includes extremes of both poverty and wealth. On one end of the spectrum, Washington has a disproportionately large number of people experiencing homelessness. With more than 21,500 people homeless, Washington ranks 5th nationally on this metric, behind only four much more populous states: California, New York, Florida, and Texas.[36] Roughly one-quarter of Washington’s homeless population is made up of families with children. [37] At the other end of the economic spectrum, Washington is home to a disproportionate share of the nation’s and, indeed, the world’s billionaires. The collective wealth of Washington state’s 13 known billionaires jumped by $151.2 billion, or 47%, between the onset of the Covid pandemic in mid-March 2020 and January 29, 2021.[38] The unbalanced state tax system has failed to include their resources in building shared prosperity.
Figure 4.
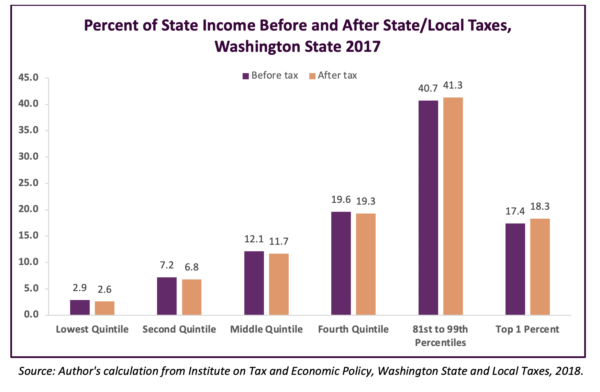
Washington’s tax system widens the already large gap between rich and poor.[39] Figure 4 illustrates the impact of Washington’s tax system on households across the income distribution. Prior to taxation, households in the lower 80 percent of the income distribution receive a total of about 42 percent of income, with those in the top 20 percent receiving a total of 58 percent. After state and local taxation, the total share of income going to those in the lower 80 percent falls from 42 to 40 percent, while the share of the top 20 percent rises from 58 to 60 percent.
Further, Washington’s regressive tax system reduces economic mobility—the potential for individuals to scale the steep economic ladder. By imposing its highest tax rates on the lower- and middle-income households, Washington’s tax system worsens the life chances of children growing up in those households. The inadequacy of the tax system limits the state’s ability to provide the sort of equitable and high-quality public services that could level the playing field. In the words of one economist, regressive taxation “strips the states that run in this direction of the revenue they need to run first class institutions that could potentially equalize, or at least take a stab at improving, the public services that could help to support better life chances for the poor.”[40]
Moving from Affluence to Prosperity
Washington is not a poor state. Its 2019 median household income of $78,700 was significantly higher than the $65,700 of the U.S. as a whole, and placed it seventh among the 50 states.[41] In 2019, only New York, Massachusetts, and the District of Columbia had greater GDP per capita. However, Washington is experiencing affluence without prosperity, with shared prosperity defined as the “condition of being successful or thriving.” The well-being of its citizens does not match its private affluence. We have an anti-commonwealth.
Washington state has several possibilities to move toward a more equitable and inclusive tax structure. All involve bringing the resources of the most affluent households and corporations into the state’s tax base at appropriate rates.
Several measures on the table in Washington’s 2021 Legislative session could move the state toward greater prosperity:
- Tax on Extraordinary Capital Gains – SB 5096. This 7% tax on income from stocks, bonds, and other assets will exempt retirement accounts, sale of homes or farms, and investment earnings of less than $250,000 per individual. Most other states tax this income. It will raise $500 million annually beginning in fiscal year 2023.
- Estate Tax Reform – HB 1465. The proposed legislation will exempt estates of deceased state residents valued less than $2.5 million and raise rates on the largest estates, raising about $100 million annually to be dedicated to housing security assistance and a new Equity in Housing Fund.
- Wealth Tax – HB 1406. This new 1% tax would be on the total value of stocks, bonds, and other intangible assets over a threshold to be set between $100 million and $1 billion. At a $1 billion threshold, fewer than 100 of our state’s wealthiest individuals would pay the tax, and it would raise $2.5 billion annually beginning in 2023 to invest in childcare, public health, access to higher education, and a more equitable and sustainable economy.
- Closing Investment Tax break – HB 1111. High income generating corporations and nonprofits often stash their excess wealth in stocks and other investments, generating even more income, rather than lowering prices, investing in research, or raising wages for rank-and-file employees. Most states tax this income through corporate income taxes, but Washington does not. Eliminating this tax break could generate about $250 million annually to reinvest in health care and other vital services for state residents.
Each of these measures leverages a small percentage of the resources of the affluent for public services for all. Together, these revenues can build the foundation for a more prosperous future.
Investing in the Future
Prosperous states and countries build toward the future. They invest in education, research, and infrastructure in order for current and future generations to thrive. Prosperous states and countries have adequate tax revenues to support the quality of life of their residents and to care for the natural environment.
A more equitable and inclusive tax system would enable Washington to make the investments in education, research, and infrastructure that create the foundation for future prosperity. Broader-based and more equitable taxes would also provide resources to support the quality of life of Washington residents and to care for the natural environment.
Education
Investment in education creates a virtuous circle, provided the state has a fair tax system. States that invest heavily in education—from preschool through college—are able to develop a workforce that commands much higher wages. Higher earnings, in turn allow states to generate revenue through income taxes. Absent such progressive taxes, the state’s ability to invest in education is compromised and the virtuous circle is broken. Washington state provides such a case study in disinvestment in education over the past four decades.
Beginning with Washington’s youngest children, a stronger tax system could support expanded access to public pre-K education. Economists, notably Nobel-prize winner James Heckman, have built a strong case that investing in quality early childhood education—birth to age five—creates better education, health, social and economic outcomes that ultimately increase revenue and reduce the need for costly social spending.[42] Washington has not heeded this advice. In 2017, Washington ranked 32nd out of the 50 states in the percent of its children attending public pre-K education, with only 6.4 percent of 3-4-year-olds enrolled as compared to a nation-wide average of 19.0 percent.[43] With an investment of $3.36 billion, Washington could expand pre-K education to cover 60 percent of children ages 0 to 4 across the state, with tuition based on income and ninety percent of families gaining free or reduced-cost child care.[44]
A stronger tax system is also needed to restore the financial foundation of Washington’s K-12 education system. In 1998 Washington’s spending in K-12 education was 4.3 percent of personal income. By 2018, that number was only 3.9 percent.[45] The under-funding of education became so grave that in 2007, two families sued the state of Washington for failing to meet its constitutional obligation to provide education.[46] When the case finally arrived before the Supreme Court in January 2012, the Court ruled that the Legislature had failed to “make ample provision for the education of all children residing within its borders,” as called for by the Constitution.[47] Two years later, in 2014, the court found the Legislature in contempt for its failure to provide a plan for fully funding K-12 public education by September 1, 2018.
Thanks to the court’s ruling, the situation has improved a bit since then, but more is needed. Research on economic mobility finds that quality K-12 education is essential to the life chances of children growing up in lower-income households.[48] Washington’s educational system remains underfunded and uneven. In 2014, voters passed a ballot initiative requiring smaller class sizes in K-12 education, but the Legislature did not fund the class size reductions.[49] In 2018, Washington still ranked only 27th among the 50 states in its expenditures on K-12 education relative to income.[50] Washington would need to spend an additional $3.35 billion in order to bring its spending on K-12 education on par with its seventh-place rank in median income.[51] A more robust tax system would help Washington get there.
A robust tax system would also improve access to higher education for Washington residents. While Washington has a highly educated population, companies often recruit from out of state for their most educated employees.[52] Washington ranks 44th among the 50 states in the share of its 18-to-24-year-olds enrolled in higher education, just ahead of West Virginia, with only 37 percent enrolled, compared to 43 percent in the U.S. overall and 48 percent in California.[53]
A stronger tax system would enable more access to higher education for Washington residents. Washington has outstanding community colleges, colleges, and universities. However, tuition at Washington’s public colleges and universities has risen much faster than inflation for decades, and high tuition charges are now a barrier to access. For example, in 2019-20, in-state tuition at Seattle Central Community College was $3,779, as compared to $1,561 at De Anza Community College in California’s Bay Area. An estimated $1.35 billion in higher education funding would allow Washington to reduce community college and university tuition to more affordable levels and expand access to higher education.[54]
Research and Innovation
Investment in research feeds economic development and future economic growth. In total spending—public and private, Washington is a leader in this area. In 2015, Washington ranked among the top ten states in total spending on research and development (R&D), with its total R&D spending amounting to 4.5 percent of the state’s GDP.[55] The bulk of this R&D spending took place in the private sector.
In terms of state spending on R&D, in 2018, Washington ranked only 29th in the nation, dropping from 22nd the previous year. Washington’s spending on R&D was $4.93 per capita in 2018, significantly lower than the national average of $7.79 per capita. Looking at the 5-year average (2014-12018), Washington’s spending was also subpar, $5.33 as compared to a national average of $7.12.[56]
That imbalance is reflected in the Milken State Technology and Science rankings. The Milken metrics shine a light on the fact that while Washington’s private entrepreneurs are investing in R&D, they are doing so largely within the private sector and by relying on a workforce educated outside of Washington. In 2020, Washington ranked 5th among the 50 states in what the index labels “capacity for achieving prosperity through scientific discovery and technological innovation.” However, Washington ranked significantly lower in the state’s support of that capacity, ranking only 10th in “facilities that can attract funding and create innovations that can be commercialized” and only 14th in “human capital investment-skill levels and training.”[57]
A robust tax system would help tip the balance of Washington’s investments in R&D away from short-term profit motives and toward the long-term public good. The pandemic of 2020 has clearly revealed the need for ongoing research and investment in order to lay the groundwork for the public and private sectors to face the next challenge. A more balanced division of public and private spending would help fuel the sort of innovations in basic science and technology that will best serve Washington.
Infrastructure
A robust tax system is needed to maintain and build the infrastructure that will support tomorrow’s citizens and economy. Public investment in infrastructure supports and attracts economic development. A 2006 study found that a 1 percent increase in public investment led to a 0.54 percent increase in private investment.[58] Examples abound, such as coffee shops sprouting up around a new light-rail line. Today, awareness of climate change demands that we invest in the electrification of our transportation infrastructure, a project likely to stimulate both jobs and innovation. Washington is also entering into discussions with Oregon and British Columbia about the development of a high-speed rail corridor connecting the region while reducing traffic and pollution. At the same time, the need for internet access demands the construction of broadband infrastructure—the highway of the information economy.
New Taxes Help the Economy
Ever since economist Arthur Laffer sketched his infamous Laffer curve on a napkin, the idea has persisted that raising taxes is bad for the economy.[59] The idea is repeated like a steady drumbeat by anti-tax crusaders, but does not hold up to the evidence, at least for the magnitude of new taxes or rate increases that would realistically be entertained at the state level.
This idea of determining the relationship between tax rates and economic growth has led to a vast quantity of economic research debating the issue. Advocates on either side of a tax debate have numerous studies to choose from that superficially support their view. The challenge is to separate the wheat from the chaff in the debate.
Econometric studies proceed by analyzing data on the issue, examining the experiences across time and across states or countries to see whether a single pattern predominates in terms of the relationship between taxes and economic growth or between taxes and employment. A 2020 paper brings together the findings of forty-nine such studies of tax effects in OECD countries. It finds no systematic relationship between taxation and economic growth: a tax increase of 10 percent leads to modest increases in annual GDP growth (about 0.2 percent) under certain conditions and modest decreases (about 0.2 percent) under other conditions.[60]
An analysis of studies of the tax-growth relationship across U.S. states likewise finds no evidence of an overall adverse effect of taxes; finding instead that the personal income tax, corporate income tax, and property tax tend to be associated more positively with economic growth than other types of state taxes.[61] An extensive review of the literature by Washington’s Department of Revenue concluded that “there is not a robust relationship between taxes or tax burden and economic competitiveness.”[62] The report also suggested that factors such as college enrollment rate and poverty rates were more significant to competitiveness than state taxes.
Figure 5.
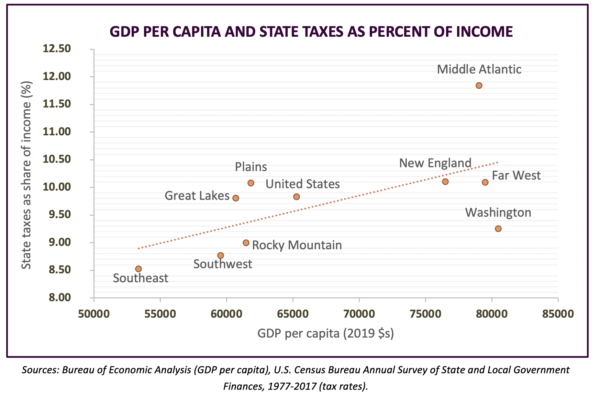
Figure 5 plots state tax rates against the per capita GDP of different regions of the U.S. If anything, the pattern suggests that with the exception of Washington, the regions with stronger economies tend to choose higher, not lower, tax rates. Likewise, statistical tests find little correlation between a state’s business tax climate, as measured by the Tax Foundation, and a state’s ability to create jobs.[63]
The experience of particular states also suggests that higher state taxes do not threaten growth, and conversely, that tax cuts do not boost economic growth. Deep tax cuts in Kansas in 2012 and 2013 failed to achieve their alleged goal of boosting business formation and job creation. In fact, after the tax cuts, Kansas experienced slower employment growth than its higher-tax neighbors as well as revenue shortfalls that led to the downgrading of the state’s bond rating. Kansas repealed the tax cuts in 2018.[64] Washington state itself experienced some of the fastest rates of economic growth in the nation in the 1990s, when its state taxes relative to income were above the national average and higher than they are today (see Figure 2)..[65]
Recent experience also suggests that state taxes are not a hindrance to growth. In January 2021, the higher-state-tax regions of the Midwest and Northeast experienced 48.6% and 47.9% in growth in new business applications, whereas the lower-state-tax West and South experienced growth rates of only 40.5% and 39.6%.[66] It is early to predict how states and regions will rebound from the pandemic, but these results at least suggest that higher state taxes do no inhibit business formation.
Will Righting WA’s Privileged Tax System Drive the Wealthiest Among us Out of the State?
This question may be answered with another question. If the wealthy leave to seek greener tax pastures, where would they go? If they go south, to Oregon or east, to Montana, they escape the sales tax but pay an income tax. If they choose sunny California, their taxes increase significantly on all fronts. Only perhaps the low-tax region of the Southeast might be attractive to wealthy individuals moving solely to save on taxes. However, as recent events have demonstrated, these states can drive up employer costs with deregulation and underinvestment in utilities and infrastructure.
Paradoxically, driving the wealthy out of the state does not hurt Washington’s state revenues as much as it might precisely because of Washington’s regressive tax system. Because Washington does not tax financial wealth or unearned income, there is little reduction of revenue when wealthy households leave the state. Regarding the potential loss of property tax revenue, in today’s housing market, it is unlikely that the homes they leave behind will remain empty or fall in value.
Regarding business relocation as a result of higher taxation, a tax commission report from Georgia is enlightening on the issue. Based on the commission’s meetings with the economic development community, this bipartisan state commission concluded that factors such as “quality of life, a trainable workforce, and infrastructure” have greater weight in business location decisions than do taxes.[67]
The Bottom Line
No one wants to pay taxes simply for the sake of paying taxes. Taxes that are unreasonably high can stifle economic growth. But taxes that are too low can also inhibit growth, by failing to provide the revenue necessary to invest in education, innovation, and infrastructure. An effective tax system can transform affluence into long-term prosperity by including all Washingtonians in the project of building Washington’s future.
Washington can create a more equitable and balanced tax system and boost its economic vitality. The cost of doing otherwise is simply too high for the people of Washington.
Appendix
Table A1: Values and sources, Figure 1.
See also: https://erfc.wa.gov/sites/default/files/public/documents/publications/climate020.pdf
Table A2: State and local taxes by source as share of personal income, 2017
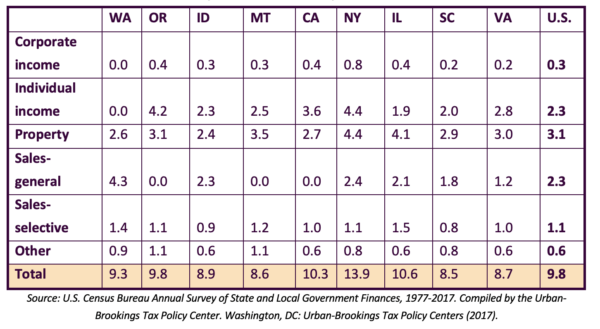
Table A3: State and local revenue by source in dollars per capita, 2017, in dollars
About the Author
Stacey M. Jones is a Senior Instructor in the Albers School of Business and Economics at Seattle University. She teaches courses in statistics and policy analysis. She is a co-author of Understanding Business Statistics (2014), a contributor to The American Middle Class: An Economic Encyclopedia of Progress and Poverty (2017), a contributor to Income Inequality in America: Causes and Consequences (2021), and co-editor of Income Inequality in America: A Reference Handbook (forthcoming, 2022). She earned a Ph.D. in economics from Stanford University.
Endnotes
[1] Washington’s 2019 GDP per capita of $80,500 put the state 4th behind New York, Massachusetts, and Connecticut. Author analysis of U.S. Bureau of Economic Analysis, https://www.bea.gov/data/gdp/gdp-state.
[2] Fortune 500 rankings, https://fortune.com/fortune500/2020/search/?hqstate=WA
[3] The Forbes 400: Definitive Rankings of the Wealthiest Americans in 2020, https://www.forbes.com/forbes-400/
[4] Elango, S. García, J.L., Heckman, J.J., and Hojman, A. 2016. Early Childhood Education. In Means-Tested Transfer Programs in the United States, Volume 2, edited by R. Moffitt. See also https://heckmanequation.org/.
[5] Cattan, S. 2016. Can Universal Preschool Increase the Labor Supply of Mothers? IZA World of Labor 312
[6] https://nces.ed.gov/programs/statereform/tab5_10.asp
[7] The Kaiser Family Foundation State Health Facts. Data Source: The U.S. Department of Housing and Urban Development, Point in Time Estimates of Homelessness, 2020, March 2021.
https://www.kff.org/state-category/demographics-and-the-economy/homelessness/
[8] US Census Bureau. 1977-2017. Annual Survey of State and Local Government Finances, 1977-2017. Compiled by the Urban-Brookings Tax Policy Center. Washington, DC: Urban-Brookings Tax Policy Centers (2017). https://www.taxpolicycenter.org/statistics/rankings-state-and-local-general-revenue-percentage-personal-income
[9] The Far West as defined by the Bureau of Economic Analysis includes Washington, Oregon, California, and Nevada. Total WA personal income of $ 433795.9 million from U.S. Bureau of Economic Analysis and Federal Reserve Bank of St. Louis, Total Personal Income in Washington [WAOTOT], retrieved from FRED, Federal Reserve Bank of St. Louis; https://fred.stlouisfed.org/series/WAOTOT, March 25, 2021.
https://fred.stlouisfed.org/series/WAOTOT.
[10] Conway, Richard S. Jr. 2017. Washington State and Local Tax System: Dysfunction and Reform.
[11] Tsang, Amie. 2014. Amazon HQ2: How New York and Virginia Won the Beauty Contest. Beauty Contest. New York Times, November 14. https://www.nytimes.com/2018/11/14/technology/amazon-hq2-newyork-virginia-recap.html. Subsequent backlash from lawmakers, progressive activists, and union leaders led Amazon to retreat from its decision to locate a headquarters in New York. See Goodman, J. David. 2019. Amazon Pulls Out of Planned New York Headquarters. New York Times, February 14. https://www.nytimes.com/2019/02/14/nyregion/amazon-hq2-queens.html
[12]Live 5 WCSC. 2021. Boeing 787 assembly consolidation in South Carolina to begin in March. January 27. https://www.live5news.com/2021/01/28/boeing-assembly-consolidation-south-carolina-begin-march-2/
[13] Federation of Tax Administrators, 2021. https://www.taxadmin.org/assets/docs/Research/Rates/ind_inc.pdf
[14] New Hampshire Department of Revenue Administration, 2021. https://www.revenue.nh.gov/faq/interest-dividend.htm.
[15]Federation of Tax Administrators, 2021. https://www.taxadmin.org/assets/docs/Research/Rates/stg_pts.pd
[16] In 2020, 28 states and the District of Columbia had a state-level EITC, which was refundable in 22 of the 29 cases. Refundable here means, for example, that if an individual owed $150 in federal taxes and was eligible for a $200 credit, the federal government would refund the difference, $50, to the individual. See Tax Policy Center, State EITC as Percentage of the Federal EITC, 2000-2019. https://www.taxpolicycenter.org/statistics/state-eitc-percentage-federal-eitc
[17] Washington State Department of Revenue, Research and Fiscal Analysis Division. Tax Statistics 2020. https://dor.wa.gov/about/statistics-reports/tax-statistics/tax-satistics-2020 (identical to #s 17 and 21).
[18] See Appendix, Table A2.
[19] Washington State Department of Revenue, Research and Fiscal Analysis Division. Tax Statistics 2020. https://dor.wa.gov/about/statistics-reports/tax-statistics/tax-satistics-2020
[20] Foothills Toyota Scion, 2021.https://www.foothillstoyota.com/lowest-sales-tax-in-wa/
[21] See Appendix, Table A2.
[22]Washington Senate Ways and Means Committee. 2020. A Legislative Guide to Washington’s Tax Structure. https://leg.wa.gov/LIC/Documents/EducationAndInformation/Guide%20to%20WA%20State%20Tax%20Structure.pdf
[23]Washington State Department of Revenue, Research and Fiscal Analysis Division. Tax Statistics 2020. https://dor.wa.gov/about/statistics-reports/tax-statistics/tax-satistics-2020
[24] Except public utilities, which have a separate receipts tax.
[25] In 2020, the Washington’s Department of Revenue listed a total of 195 exemptions: 23 credits, 47 deductions, 10 exclusions, 85 exemptions, 29 preferential rates, and 1 waiver https://dor.wa.gov/about/statistics-reports/tax-exemptions-2020.
[26]Washington State Department of Revenue. Tax exemptions 2020. https://ofm.wa.gov/washington-data-research/economy-and-labor-force/distribution-income-wealth-and-taxes-across-washington-households
[27]Conway, Dick. 2018. Washington State and Local Tax System Dysfunction & Reform. https://dor.wa.gov/sites/default/files/legacy/Docs/Pubs/Misc/TechAdvisoryGroup/WATaxSystem_DOR.pdf
[28] Newman, Katherine S. and O’Brien, Rourke L. 2011. Taxing the Poor: Doing Damage to the Truly Disadvantaged. Berkeley: University of California Press.
[29]Mazerov, Michael. 2009. Expanding Sales Taxation of Services: Options and Issues. Center on Budget and Policy Priorities. August 10. https://www.cbpp.org/research/state-budget-and-tax/expanding-sales-taxation-of-services-options-and-issues
[30]Figure 6, Caruchet, Matthew. 2018. Who Really Pays: An Analysis of the Tax Structures in 15 Cities Throughout Washington State. Economic Opportunity Institute. April 4. https://www.opportunityinstitute.org/research/post/who-really-pays-an-analysis-of-the-tax-structures-in-15-cities-throughout-washington-state/.
[31] US Census Bureau. 1977-2017. Annual Survey of State and Local Government Finances, 1977-2017. Compiled by the Urban-Brookings Tax Policy Center. Washington, DC: Urban-Brookings Tax Policy Centers (2017). https://www.taxpolicycenter.org/statistics/rankings-state-and-local-general-revenue-percentage-personal-income).
[32] Goodell, Emily. 2018. Changes coming to Washington driver’s license to comply with feds. Seattle Times, June 17. https://www.seattletimes.com/seattle-news/changes-coming-to-washington-drivers-license-to-comply-with-feds/
[33] Net capital gains reported on WA’s federal tax returns totaled $24 billion in 2016, 8.7% of AGI. McNichol, Elizabeth. 2018. State Taxes on Capital Gains. Center on Budget and Policy Priorities, December 11. https://www.cbpp.org/research/state-budget-and-tax/state-taxes-on-capital-gains
[34] Calculated from Internal Revenue Service. Tax Year 2017. Statistics of Income Historical Table 2. https://www.irs.gov/statistics/soi-tax-stats-historic-table-2
[35] Bartlett, Bruce. 2013. ‘Financialization’ as a Cause of Economic Malaise. Economix blog, New York Times, June 11.https://economix.blogs.nytimes.com/2013/06/11/financialization-as-a-cause-of-economic-malaise/
[36] The Kaiser Family Foundation State Health Facts. Data Source: The U.S. Department of Housing and Urban Development, Point in Time Estimates of Homelessness, 2020, March 2021.
https://www.kff.org/state-category/demographics-and-the-economy/homelessness/
[37] The Kaiser Family Foundation State Health Facts. Data Source: The U.S. Department of Housing and Urban Development, Point in Time Estimates of Homelessness, 2020, March 2021.
https://www.kff.org/state-category/demographics-and-the-economy/homelessness/
[38] Americans for Tax Fairness. 2021. Billionaires. https://americansfortaxfairness.org/issue/washington-billionaires-got-151-billion-richer-first-10-months-pandemic-collective-wealth-jumping-nearly-one-half/; Westneat, Danny. 2021. The billionaires’ tax may be absurd, but that makes it right at home for these times. 2021. Seattle Times, January 40. https://www.seattletimes.com/seattle-news/politics/the-billionaires-tax-may-be-absurd-but-that-makes-it-right-at-home-for-these-times/
[39]Cooper. D.; Lutz, B., Palumbo, M. 2015. The Role of Taxes in Mitigating Income Inequality Across the U.S. States. National Tax Journal, vol 68(4), pp. 943-974. http://byron.marginalq.com/cooper_lutz_palumbo_2015.pdf
[40] Regressive taxation is defined as a tax system in which lower income taxpayers pay a greater share of their income in taxes than do higher-income taxpayers. Newman and O’Brian, 2011, Taxing the Poor, p. 152.
[41] Guzman, Gloria. 2020. Household Income: 2019. American Community Survey Briefs. ACSBR/20-03.
[42] Heckman, James J. Invest in early childhood development: Reduce deficits, strengthen the economy. The Heckman Equation project. Accessed March 15, 2021. https://heckmanequation.org/resource/invest-in-early-childhood-development-reduce-deficits-strengthen-the-economy/
[43]Some states significantly exceed the national level, such as Vermont, where 67.5 percent of 3-4-year-olds in public preschool. National Center for Education Statistics, Percent and number of children enrolled in state prekindergarten programs, by state: 2016-17. https://nces.ed.gov/programs/statereform/tab5_10.asp
[44] This estimate is based on the Seattle Pre-K tuition model: no tuition for a family of four up to $90,000; reduced tuition up to $200,000. See Seattle.gov, Programs for 3 and 4 year olds, https://www.seattle.gov/education/for-parents/3—4-years
[45] Washington Office of Financial Management, K-12 education expenditures per $1,000 personal income, 1980-2018. https://ofm.wa.gov/washington-data-research/statewide-data/washington-trends/revenue-expenditures-trends/k-12-education-expenditures-1000-personal-income
[46]Washington Courts. McCleary, et al. v. State of Washington. Supreme Court Case Number 84362-7. https://www.courts.wa.gov/appellate_trial_courts/SupremeCourt/?fa=supremecourt.McCleary_Education.
[47]Washington State Legislature. Constitution of the State of Washington. https://leg.wa.gov/CodeReviser/Pages/WAConstitution.aspx
[48] Chetty, Hedren, Kline, and Saaz. 2014. Where is the Land of Opportunity? The Geography of Intergenerational Mobility in the United States. Quarterly Journal of Economics, vol. 129(4), pp. 1553-1623. The paper finds five factors strongly correlated with upward mobility (opportunity): 1) segregation-areas segregated by race and income have lower mobility; 2) inequality-areas with high Gini coefficients have less mobility, 3) high-quality K-12 school systems; 4) social capital indices-strong social capital and community networks, and 5) stronger family structures.
[49]State of Washington House of Representatives, 2014. Summary of Initiative 1351. https://leg.wa.gov/House/Committees/OPRGeneral/Documents/2014/I-1351Summary.pdf
[50] Washington Office of Financial Management, K-12 education expenditures per $1,000 personal income, 1980-2018. https://ofm.wa.gov/washington-data-research/statewide-data/washington-trends/revenue-expenditures-trends/k-12-education-expenditures-1000-personal-income
[51] An increase from $1,838 to $2,298 in current K-12 spending per capita would bring Washington’s education spending to the level of 7th ranked Rhode Island. See National Center for Education Statistics. 2019, Digest of Education Statistics, Table 106.40. https://nces.ed.gov/programs/digest/d19/tables/dt19_106.40.asp?current=yes
[52] Washington Office of Financial Management. Educational Attainment, 1970-2018. In 2018, 36.7 percent of Washington residents 25 years of age or older held at least a bachelor’s degree, as compared to only 27.7 percent in the year 2000. https://ofm.wa.gov/washington-data-research/statewide-data/washington-trends/social-economic-conditions/educational-attainment
[53] See Appendix table A1
[54] $1.35 billion is the estimated cost of reducing WA community college and university tuition to their inflation-adjusted 1980 levels for current students. The estimate does not account for potential enrollment expansion.
[55]National Science Board. Science and Engineering Indicators 2018. https://www.nsf.gov/statistics/2018/nsb20181/assets/1038/location-of-r-d-performance-by-state.pdf
[56] https://erfc.wa.gov/sites/default/files/public/documents/publications/climate2020.pdf
[57] Washington Economic and Revenue Forecast Council. 2020. Washington State Economic Climate Study, vol. 20. December. https://statetechandscience.org/statetech.taf?page=overall-ranking&composite=hcic
[58] Erden and Holcombe, 2006. The Linkage between Public and Private Investment: A Co-Integration Analysis of a Panel of Developing Countries. Eastern Economic Journal 32: 3, pp. 479-492.
[59] Bernan, Elizabeth Popp. 2019. Trump is giving Arthur Laffer the Presidential Medal of Freedom. Economists aren’t smiling. Washington Post, June 1. https://www.washingtonpost.com/politics/2019/06/01/trump-is-giving-arthur-laffer-presidential-medal-freedom-economists-arent-laughing/
[60] Alinaghi, Nazlia, and Reed, W. Robert. 2021. “Taxes and Economic Growth in OECD Countries: A Meta-analysis.” Public Finance Review 49 (no. 1). January; pp. 3-40.
[61] Alinaghi, Nazila. Taxes and Economic Growth in the U.S. States: A Meta-Regression Analysis.
https://www.nzae.org.nz/wp-content/uploads/2017/01/Nazila-Alinaghi-NZAE2015.pdf
[62]Tax Structure Work Group. 2020. Preliminary Report: Results of Economic Analyses. https://dor.wa.gov/sites/default/files/legacy/Docs/Pubs/Misc/TaxStructureWorkGroupPrelimReport2020.pdf
[63] Conway, Richard. 2017. Washington State and Local Tax System: Dysfunction & Reform, p. vii.
[64] Mazerov, Michael. 2018. Kansas Provides Compelling Evidence of Failure of “Supply-Side” Tax Cuts. Center on Budget and Policy Priorities. January 22. https://www.cbpp.org/research/state-budget-and-tax/kansas-provides-compelling-evidence-of-failure-of-supply-side-tax
[65] Bureau of Economic Analysis. 1999 State Per Capita Income (Revised). BEA 00-27. https://www.bea.gov/news/2000/1999-state-capita-income-revised
[66] U.S. Census Bureau. 2021. Business Formation Statistics by State. https://www.census.gov/library/visualizations/interactive/bfs-by-state.html
[67] Auxier, Richard. 2016. How State Tax Commissions Approach Economic Development. Tax Policy Center. October 16. https://www.taxpolicycenter.org/publications/how-state-tax-commissions-approach-economic-development/full
More To Read
Progressive Tax Reform
March 20, 2024
I-2111: The Income Tax Ban Is A Spectacle, but One We Can’t Ignore
A way to waste time, energy, and money, I-2111 is costing more than just taxes
Progressive Tax Reform
February 2, 2024
What is REET and Why Do We Need to Reform It?
Washington State lawmakers have the chance to make a progressive tax more progressive and provide a permanent funding source for affordable housing
Progressive Tax Reform
January 23, 2024
Report: Washington no longer has the most regressive tax structure in the nation
This is both cause for celebration and a call to action
Winslow P. Kelpfroth
Well researched article, but tax policy alone doesn’t control an economy. Consider administrative restrictions as well, like zoning. Ever increasing real estate prices are partially the result of zoning and put upward pressure on rental rates, which in turn drive a portion of homelessness.
Aug 10 2021 at 10:16 AM